Candas: A Data Science Library
Leverage Canalyst data and models to
scale your workflow like never before
Leverage Canalyst data and models to
scale your workflow like never before
Candas was built by a former PM / analyst to give anyone with a little bit of Python knowledge the ability to scale their fundamental investment process. Access, manipulate, and visualize Canalyst models, without ever opening Excel. Work with full models, create and calculate scenarios, and visualize actionable investment ideas - all in a matter of minutes.
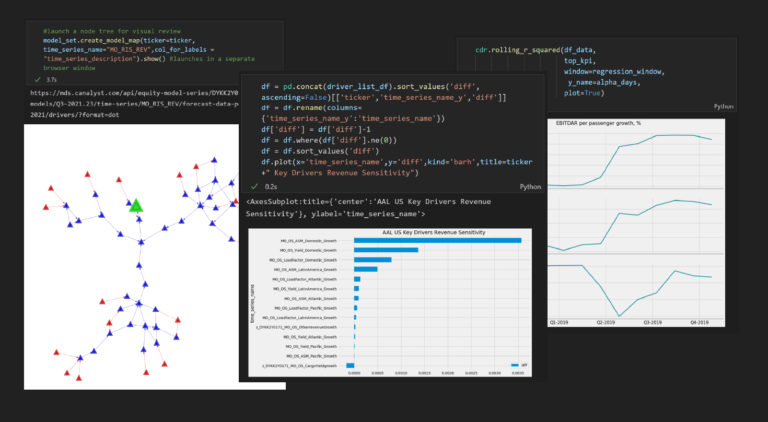
Use Candas to search for KPIs by partial or full description, filter by “key driver” – model driver, sector, category, or query against values for a screener-like functionality. Search either our full model dataset or our guidance dataset for companies which provide guidance.