Banks faced the perfect storm in early 2020. At the low, a severe COVID-19-induced economic recession coupled with a low-interest-rate environment resulted in a 38% loss YTD for the S&P financial sector versus a 26% decline for the broader index.
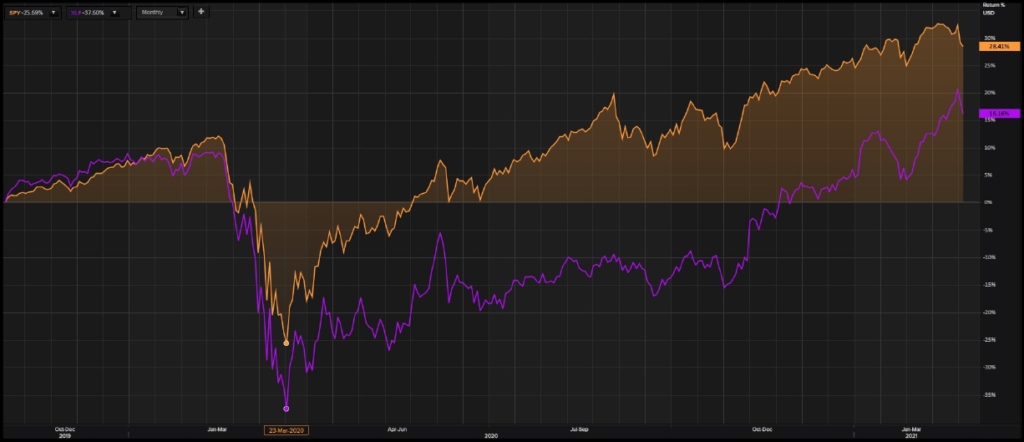
In subsequent months, a surge in retail trading volume, the central banks stimulus, combined with the highest IPO activity in a decade, allowed diversified banks to substantially change their revenue mix to counter the adverse effects of a low-interest-rate environment. Defying expectations, even pandemic-adjusted ones, the stock market recovered from its March low, surging 65% and finished 2020 up 18%. A high volume of retail investors and 454 IPOs on U.S. exchanges (which raised $167.2 billion, beating the dot-com boom record of $107.9 billion) allowed investment banking divisions of commercial banks to earn revenue through trading and underwriting activities.
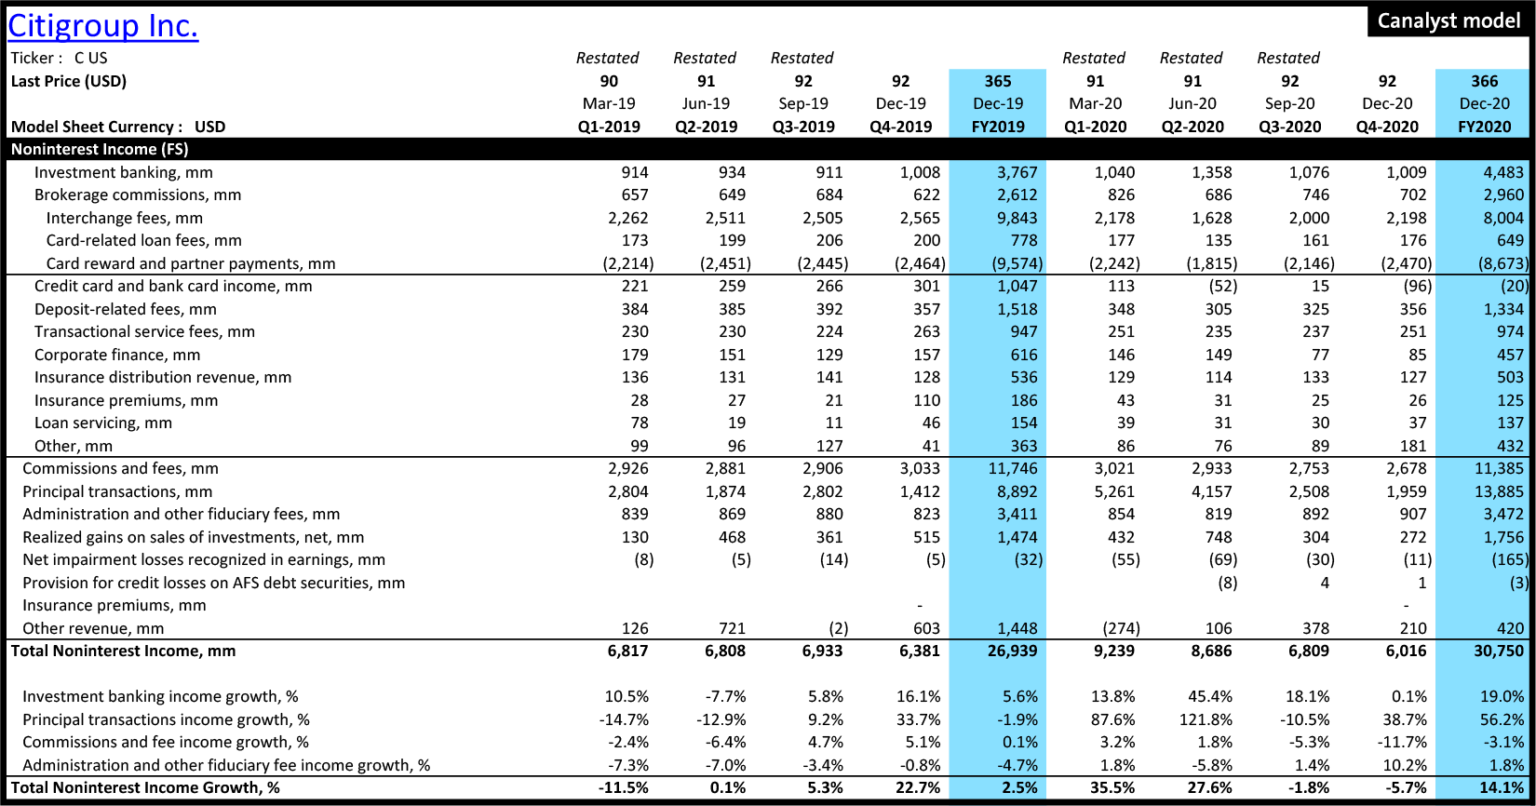
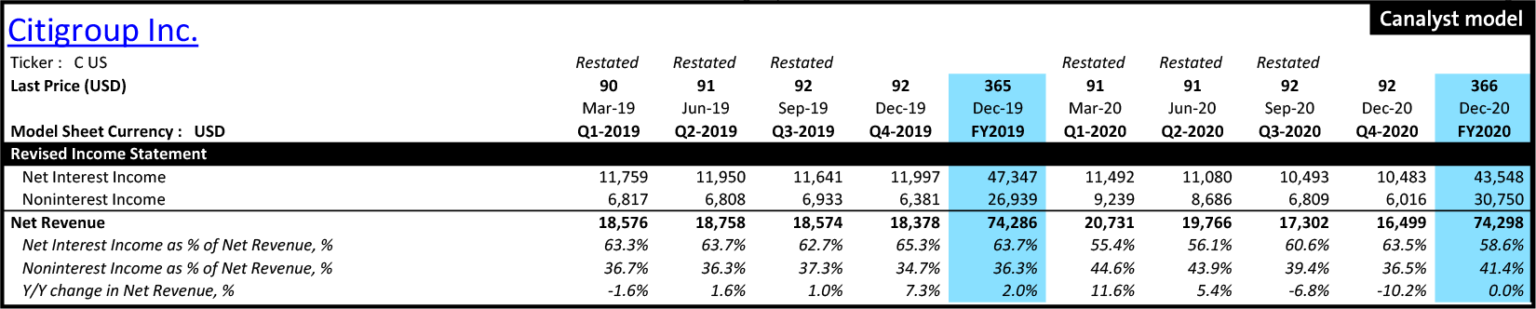
Citigroup Inc. (NYSE: C) earned almost 41% of its revenue in FY20 through non-interest income channels (highest in company history). While a massive volatility spike helped a 56% y/y growth in principal transactions, the Fed’s monetary actions boosted valuations and supported investment banking activity. Thus, Citi was able to keep their revenue almost flat y/y compared to FY19, despite the underperformance of their lending business.
And Citi is not an outlier. Other banks, including JPMorgan Chase (NYSE: JPM), Citizen Financial (NYSE: CFG), and U.S. Bancorp (NYSE: USB) all meaningfully boosted their non-interest related income, offsetting their losses caused by spikes in their provisions and decreases in their net interest income.
Moreover, for Citi, the increase in first half revenue was not associated with a corresponding increase in compensation and/or operating expenses (combined operating and compensation expenses were up 0.1% H1’20, y/y). Yet, net income took a material hit.
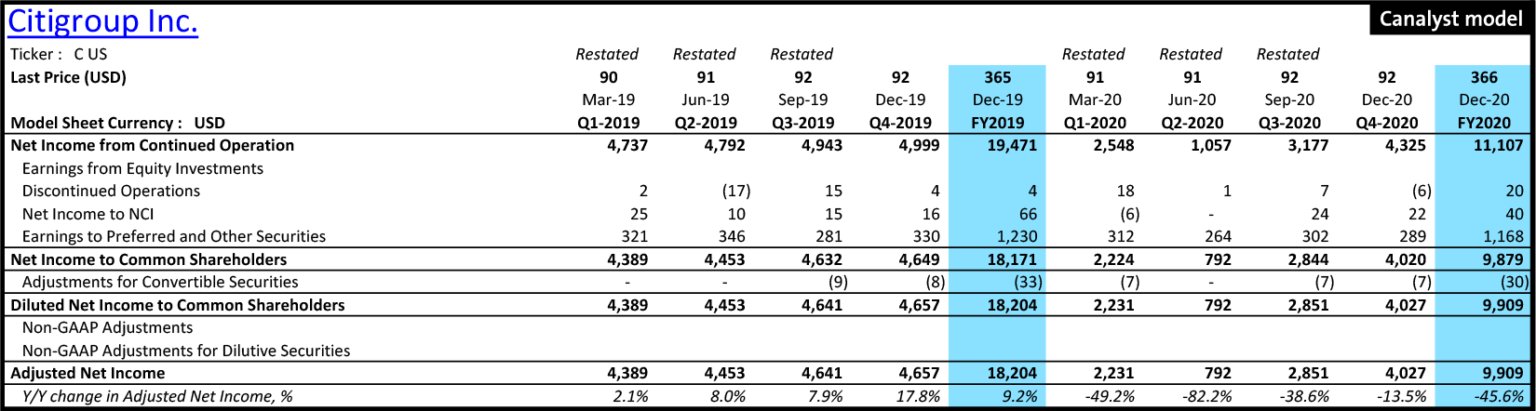
Provisions for loan losses were a material drag in H1’20. Banks materially increased their provisions through 2020 as job losses and the overall contraction of the economy increased the likelihood that consumers and corporations alike were going to have difficulty repaying their loans. Banks with exposure to heavily impacted sectors such as oil & gas, aviation & cruise lines, and retail & hospitality had to set aside more allowances than their peers to absorb the potential losses they might incur due to deteriorating business conditions for their clients. Given that Citi’s $19.3 billion oil & gas loan exposure was tops amongst their peers, their bottom line was hit hard, compressing 45.6% y/y in FY20.
Banks also had to contend with strict government regulations. Post 2008 financial crisis, regulators tightened restrictions pertaining to regulatory capital by way of the Dodd-Frank Act. These regulations better prepared financial institutions heading into the pandemic. When precautionary measures were further tightened post stress tests in June 2020, it resulted in suspensions on share buybacks and limitations on dividend payouts. Tight restrictions were relatively short-lived, however, as a second round of stress tests in December gave the Fed sufficient comfort to allow a partial relaxation of the buyback ban. This move also gave investors comfort, and contributed to a rotation back into the financials sector.
The macro environment for banks in FY21 appears materially better than FY20, thanks to the prospects of a quick economic recovery, continuing stimulus packages, and a steepening yield curve due to potential inflation heat up. An additional tailwind in the form of regulatory easing, byway of reduced restrictions on share buybacks and dividends has also bolstered the outlook for the space.