In this blog post, we take a closer look at BILL.com Holdings (NYSE: BILL), a name that stood out from the Enterprise SaaS dashboard after posting the highest quarterly y/y growth.
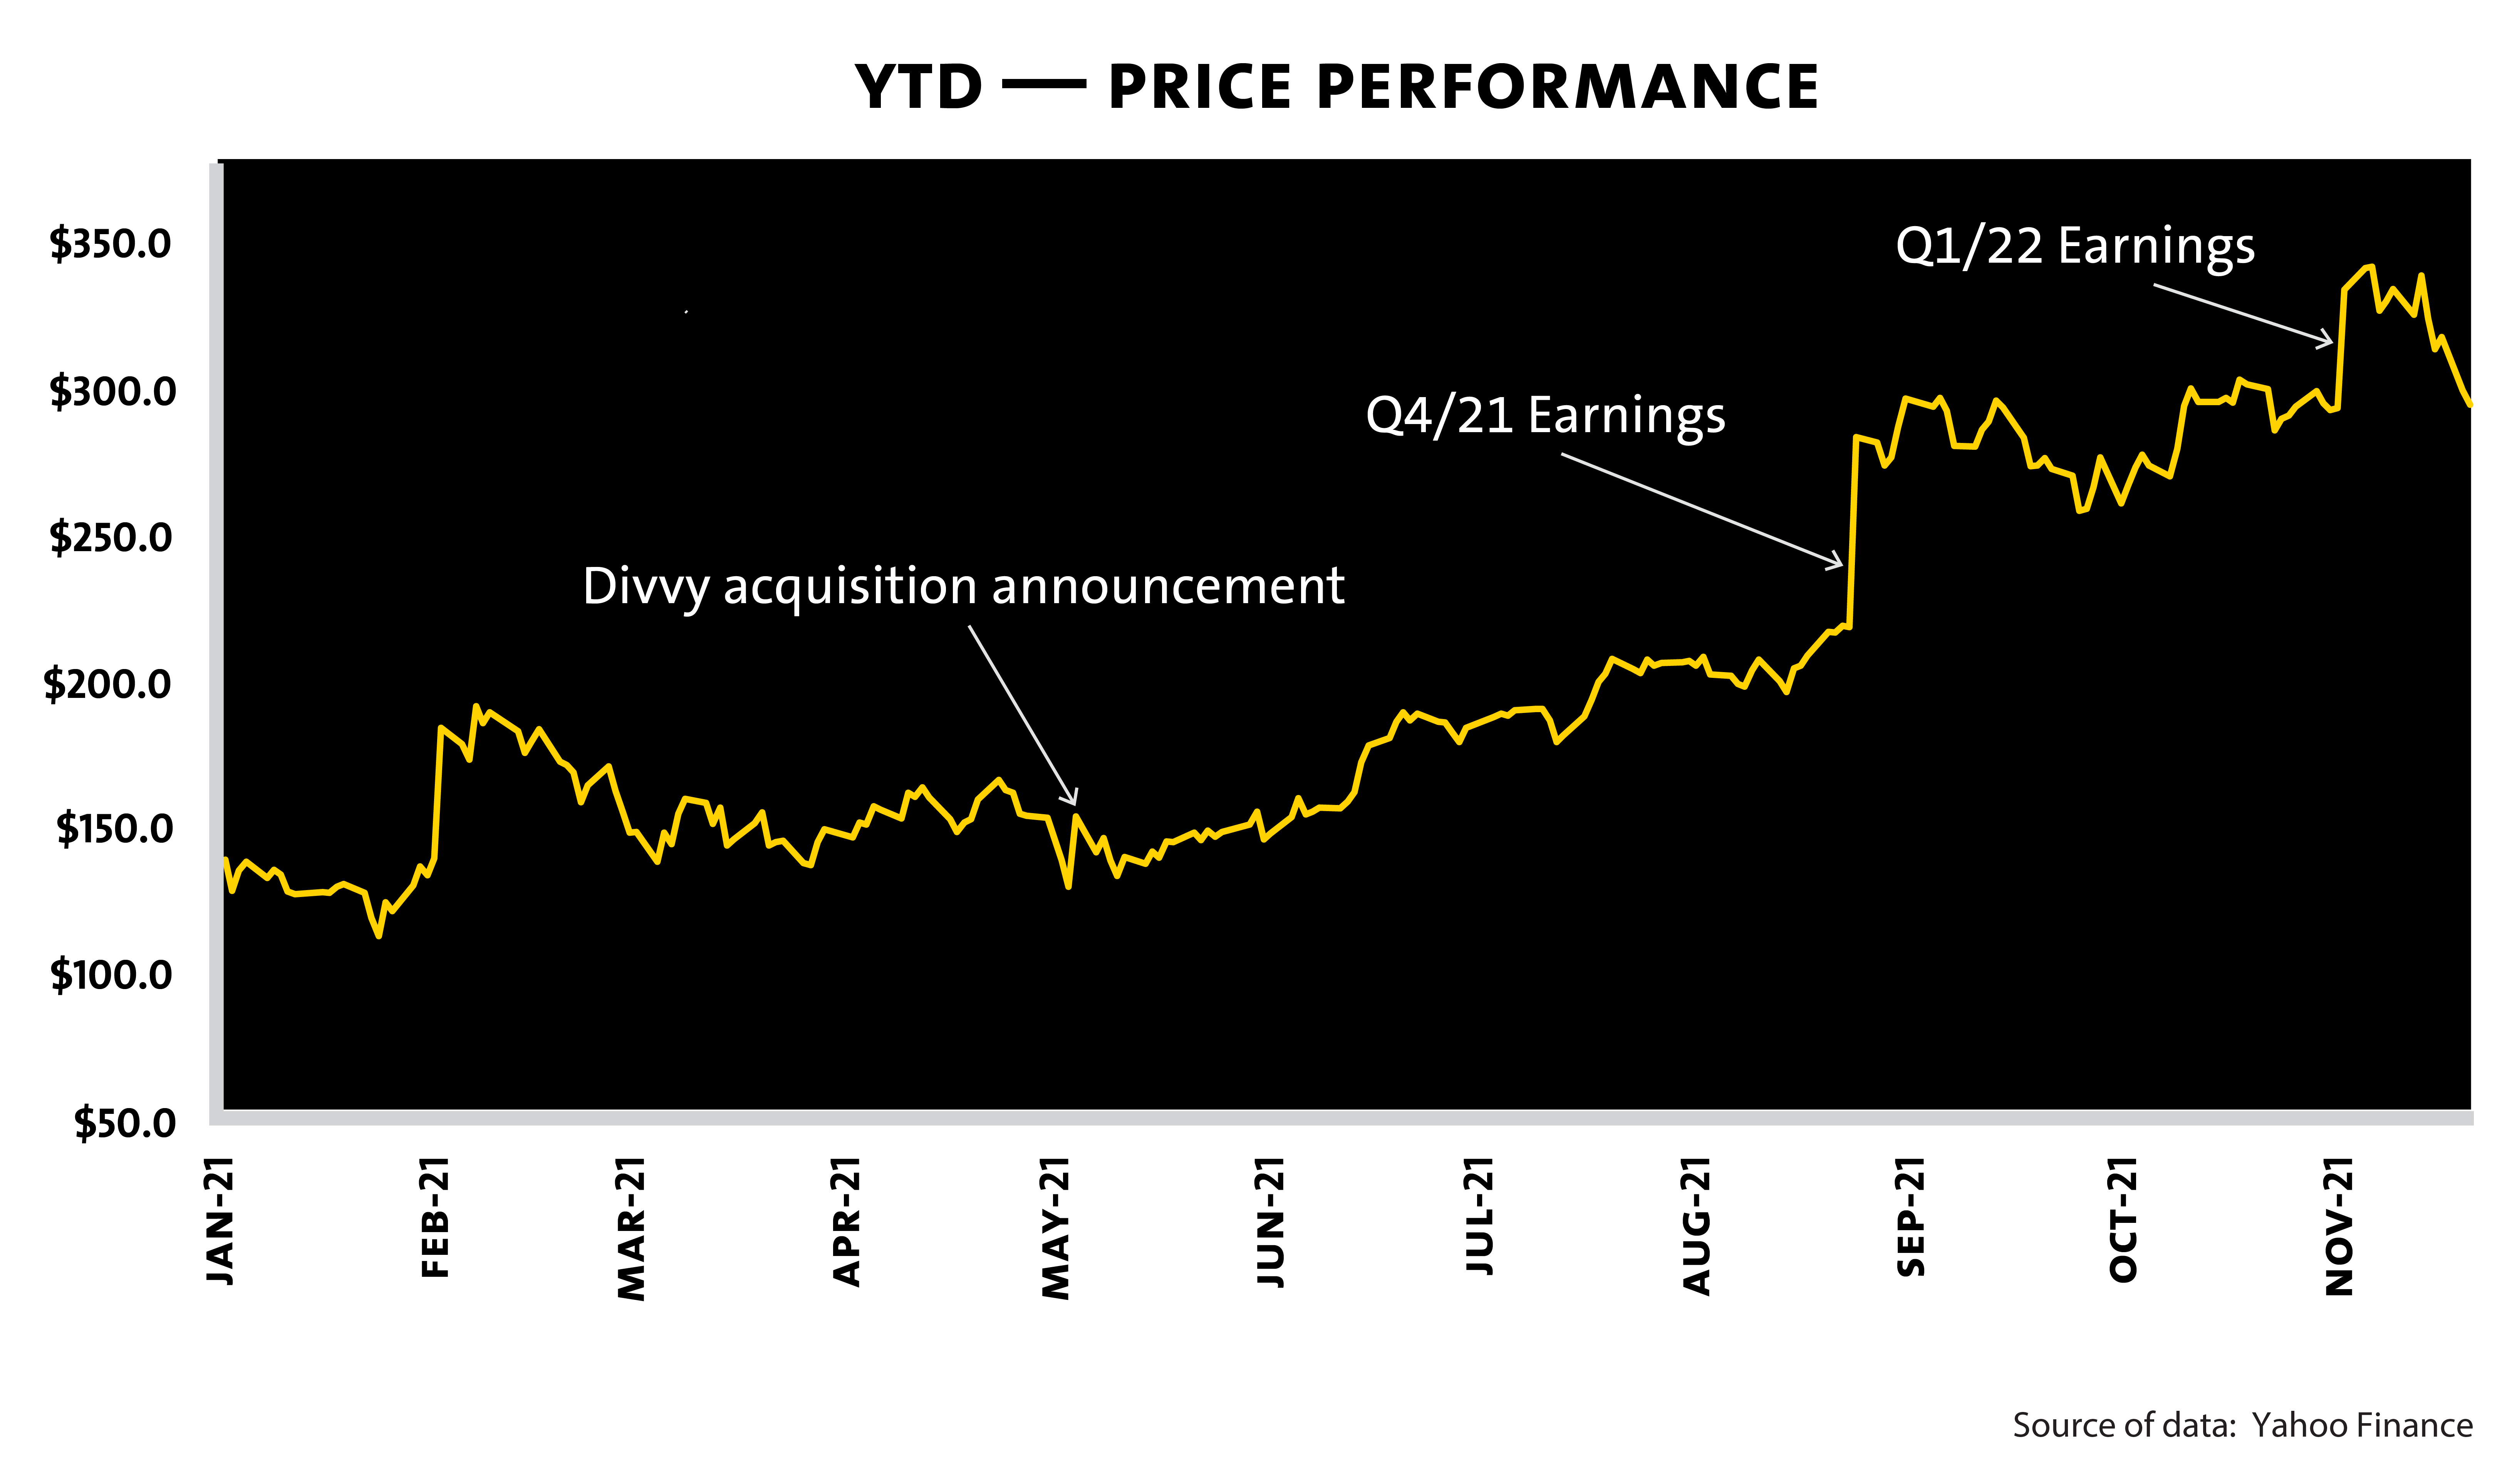
BILL had a phenomenal run in 2021, with a YTD return of 70.6% (as of December 6, 2021). BILL recently reported Q1/22 results, which solidly beat expectations, and raised guidance for FY/22; which sent the stock rallying to a new 52 week high in the post results rally (up >150% YTD on November 9, 2021).
BILL offers SaaS cloud-based payments and spend management products, which allow small and medium businesses (SMBs) in the US to automate accounts payable and accounts receivable transactions, eliminate expense reports, manage cash flows and improve back office efficiency. BILL has three revenue sources:
- Subscription revenue (30.1% of Q1/22 revenues): Generated from a pure-play SaaS model in which customers pay a recurring fee for cloud-based software solutions
- Transaction fees (69.2% of Q1/22 revenues): Derived on a fixed or variable rate/ transaction, such as check issuance, ACH, cross-border payments, virtual card issuance, and creation of invoices
- Float revenue (0.7% of Q1/22 revenues): Generates revenue from interest earned on funds held in trust on behalf of customers while payment transactions are clearing
Q1/22 was a blowout quarter for BILL with revenues of $116.4 million, up 151.9%y/y beating both guidance and consensus by 12.2% and 10.7% respectively. Adjusted EPS came in at $(0.15) vs. consensus $(0.21) and guidance range of $(0.21) to $(0.20).
The contributions from the Divvy and Invoice2go acquisitions, completed on June 1, 2021 and September 1,2021 respectively, added $37.9 million to the top line. BILL acquired Divvy in a stock-and-cash transaction valued at ~$2.3 billion. At the time of the acquisition, Divvy had annualized revenues of $100 million with a 100% revenue growth, $4 billion TPV (Total Payment Volume) and 7,500 active customers. BILL acquired Invoice2go for ~$625 million (75% in BILL stock and 25% in cash). At the time of the acquisition, Invoice2Go had $35 million in ARR and 225K subscribers.
In Q1/22, BILL disclosed that Divvy reported a stand-alone revenue growth of 187% y/y with $1.5 billion (160% y/y) in customer card expenditures. As of September 30, 2021, the total number of businesses that used Divvy’s spend management platform was ~13,500 and the total number of Invoice2go subscribers was ~226,000.
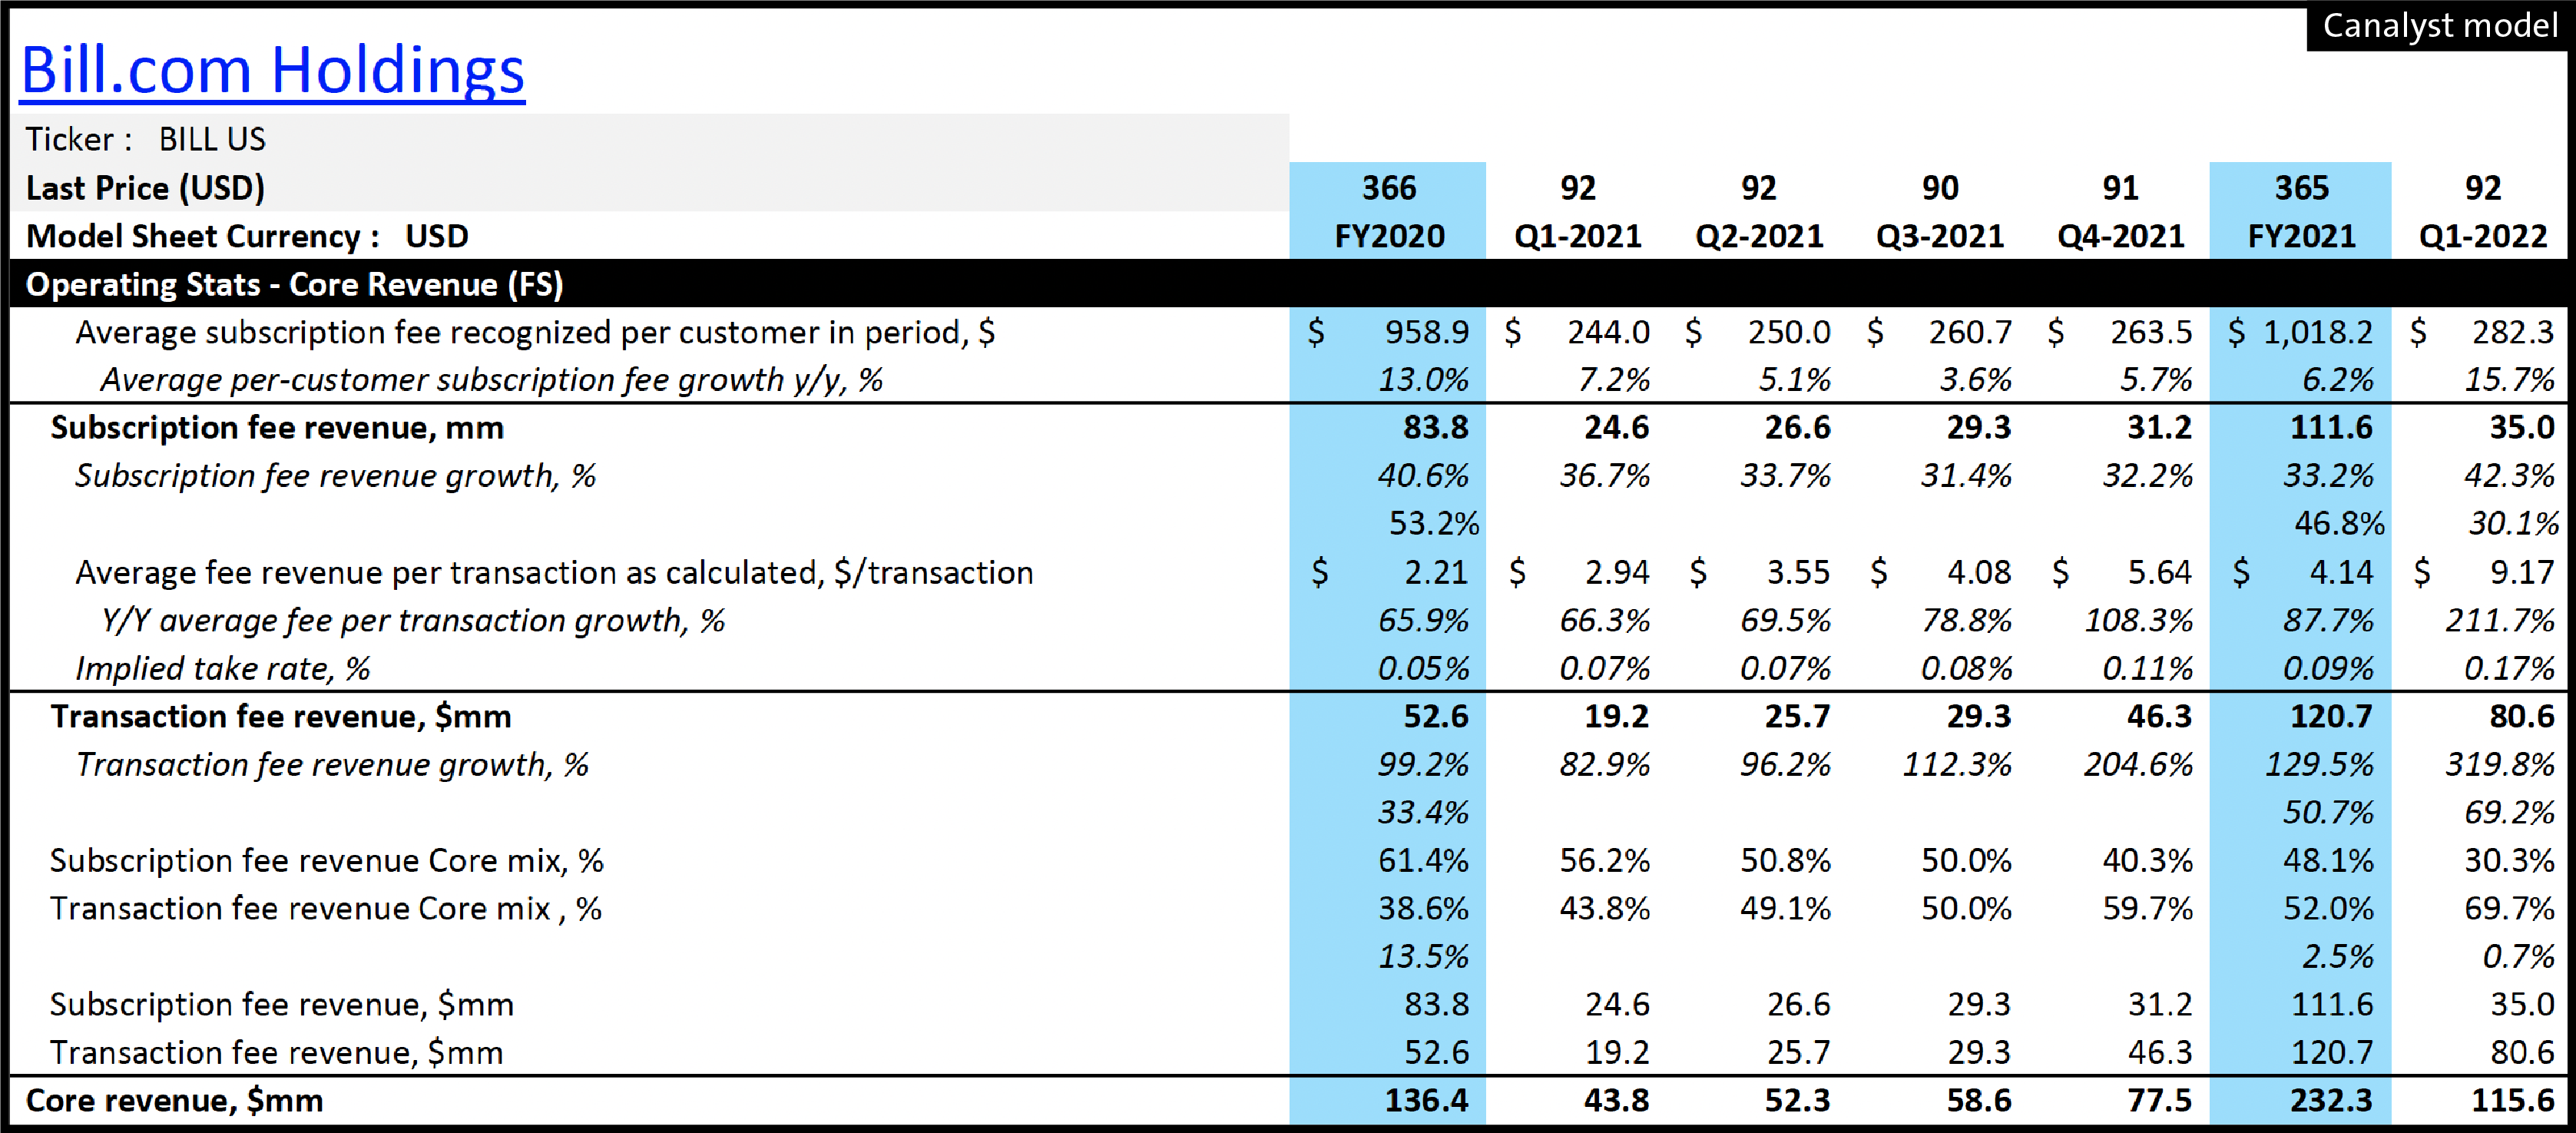
Organic growth came from $34.1 million in subscription fees which grew 39.0% y/y, and organic transaction fees of $43.7 million which rose 127.0% y/y. Overall, the organic core revenue (subscription fee and transaction fee revenue) was $77.7 million, up 78.0% y/y driven by continued strong adoption of the platform.
The Company also reported 126,800 customers and 3.2 million network members. A paying customer on the BILL platform can register its suppliers and vendors as “Network Members” so that those businesses can receive electronic payments through the platform. BILL now has a network of more than 3.2 million users connected to each other through the platform.
Network members do not pay for BILL’s services, but have registered on the platform, most likely due to a prior transaction with a BILL’s customer. Paying customers can easily transact with network members and new businesses can easily join the network if they are not currently members. These businesses are a source of warm leads for new customer acquisition for BILL and it uses this large pool of network members as a low-cost customer acquisition channel.
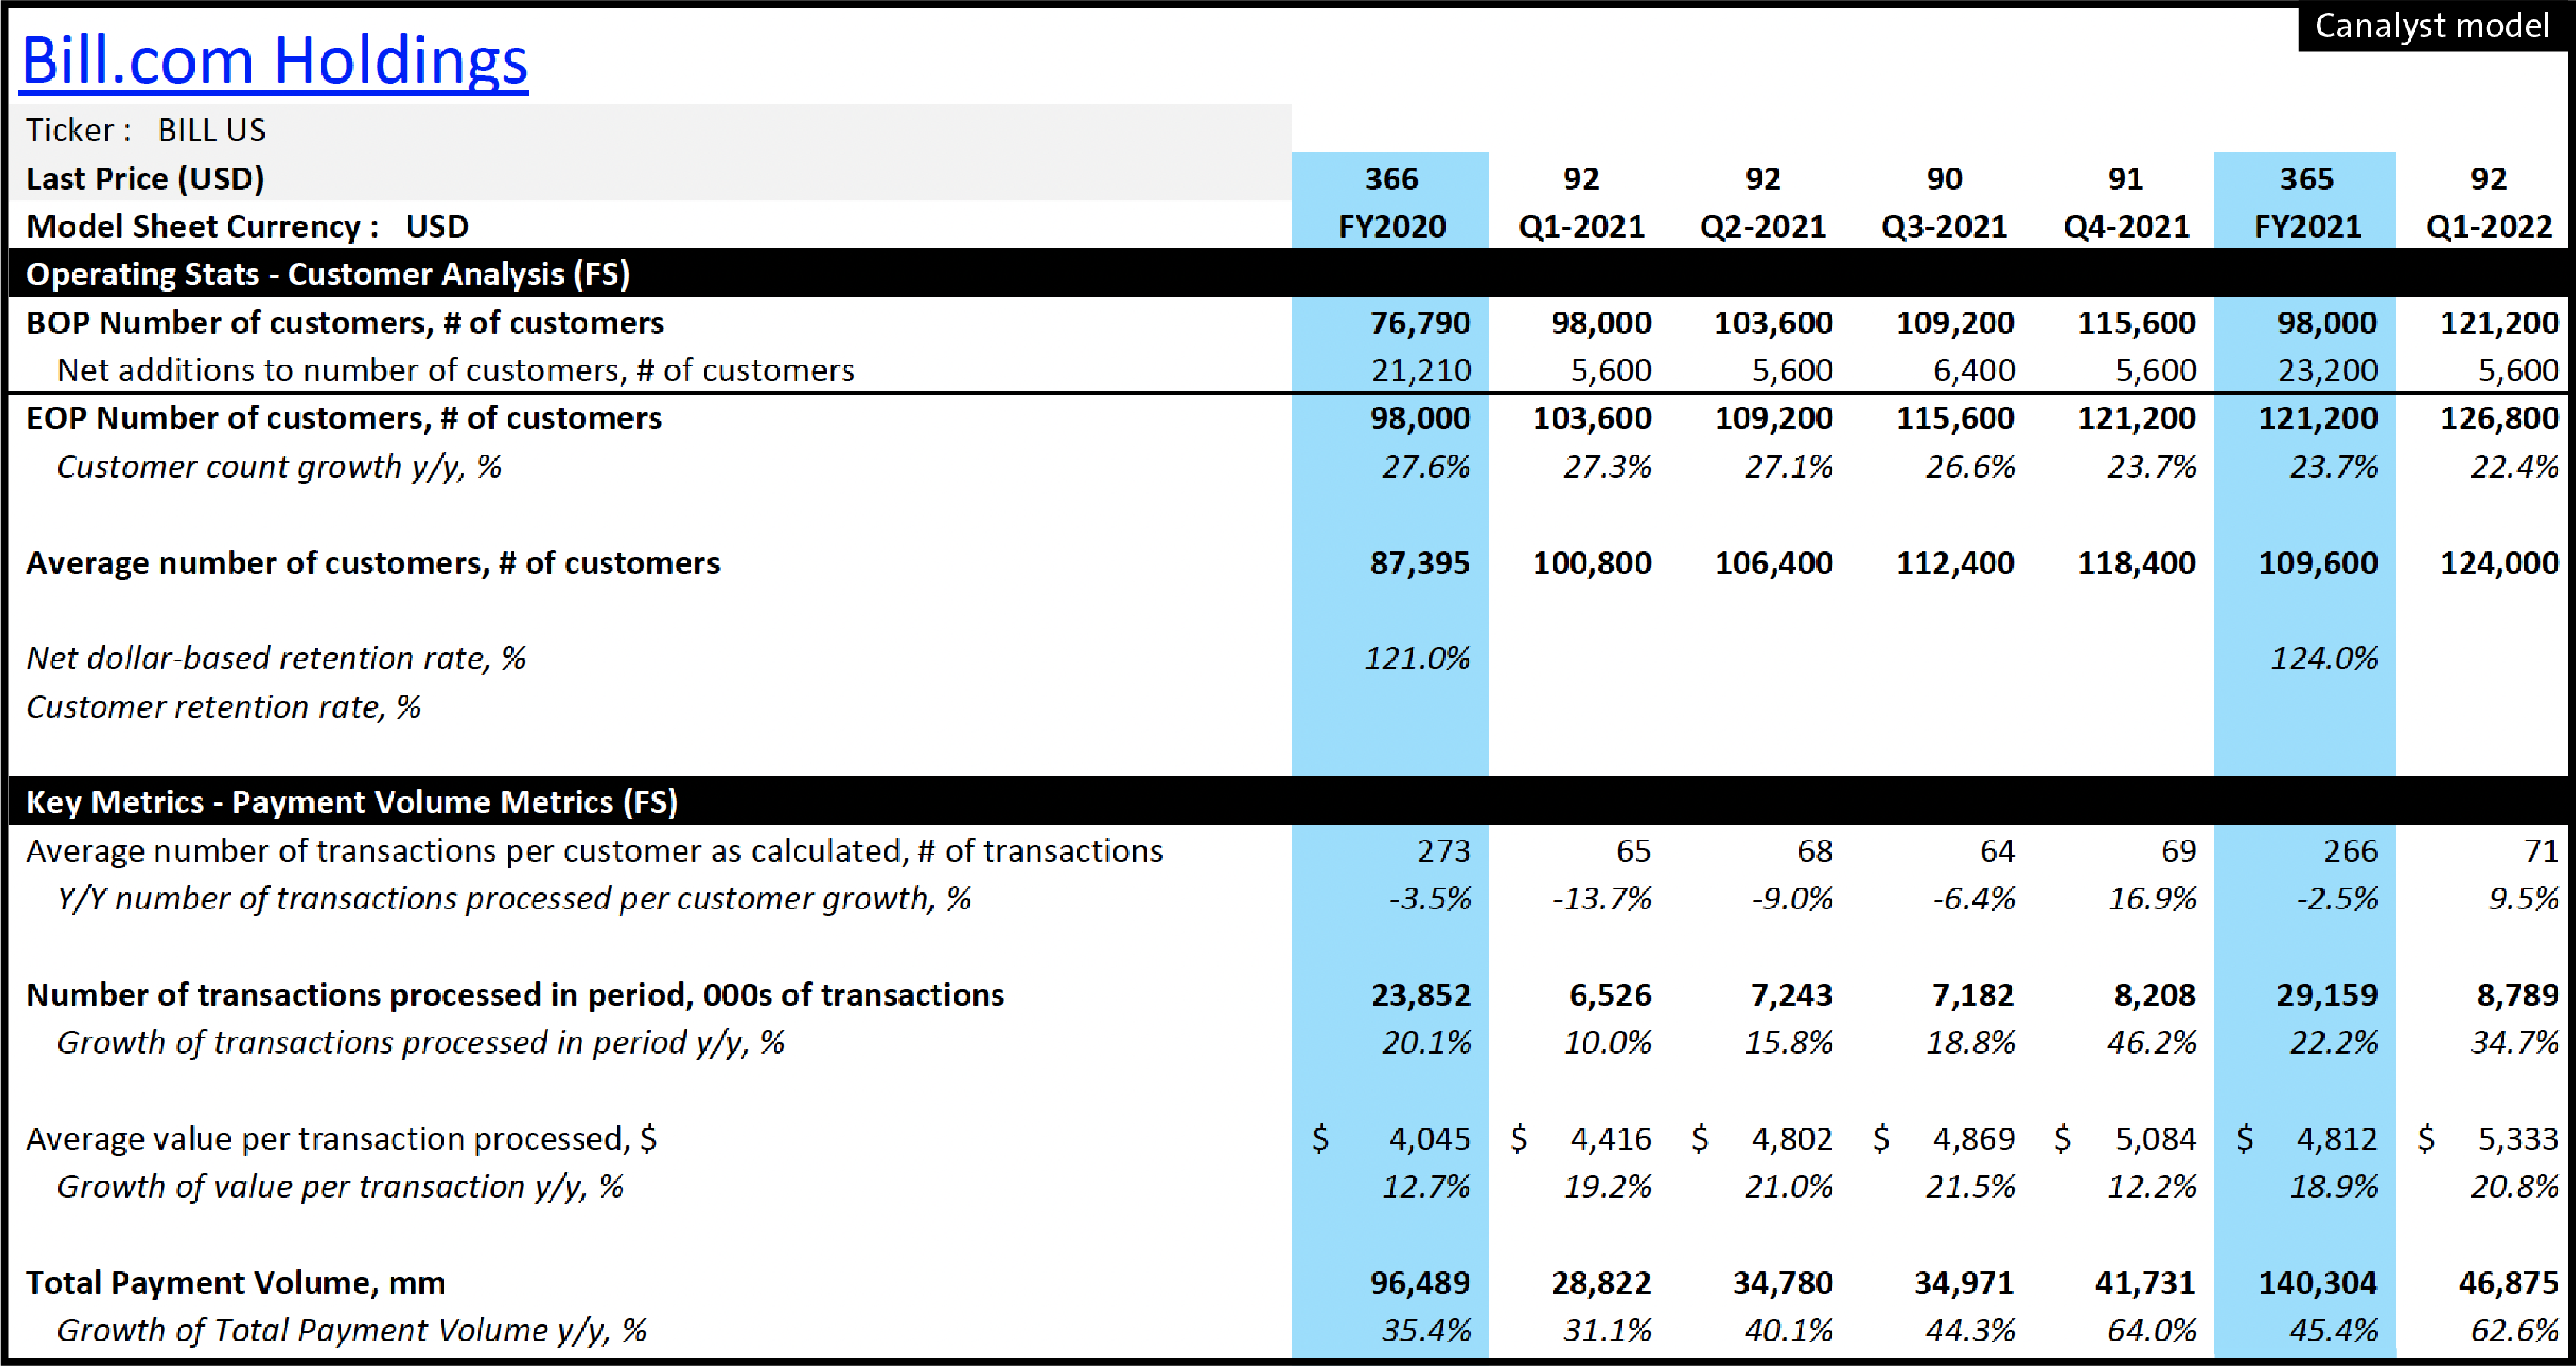
The Company also reported a TPV of $46.9 billion, which grew 63% y/y driven by growth in customers and increased activity on the BILL platform. TPV per customer and average value per transaction processed increased 32.9% y/y and 20.8% respectively, as BILL expanded its services to businesses in the mid-market segment from the SMB segment. The implied take rate also expanded from 0.07% in Q1/21 to 0.17% in Q1/22 as gross fee on Divvy’s services appears to be higher than standalone BILL services. Another driver of this increasing take rate has been a change in payment mix and increased adoption of variable transaction fee service.
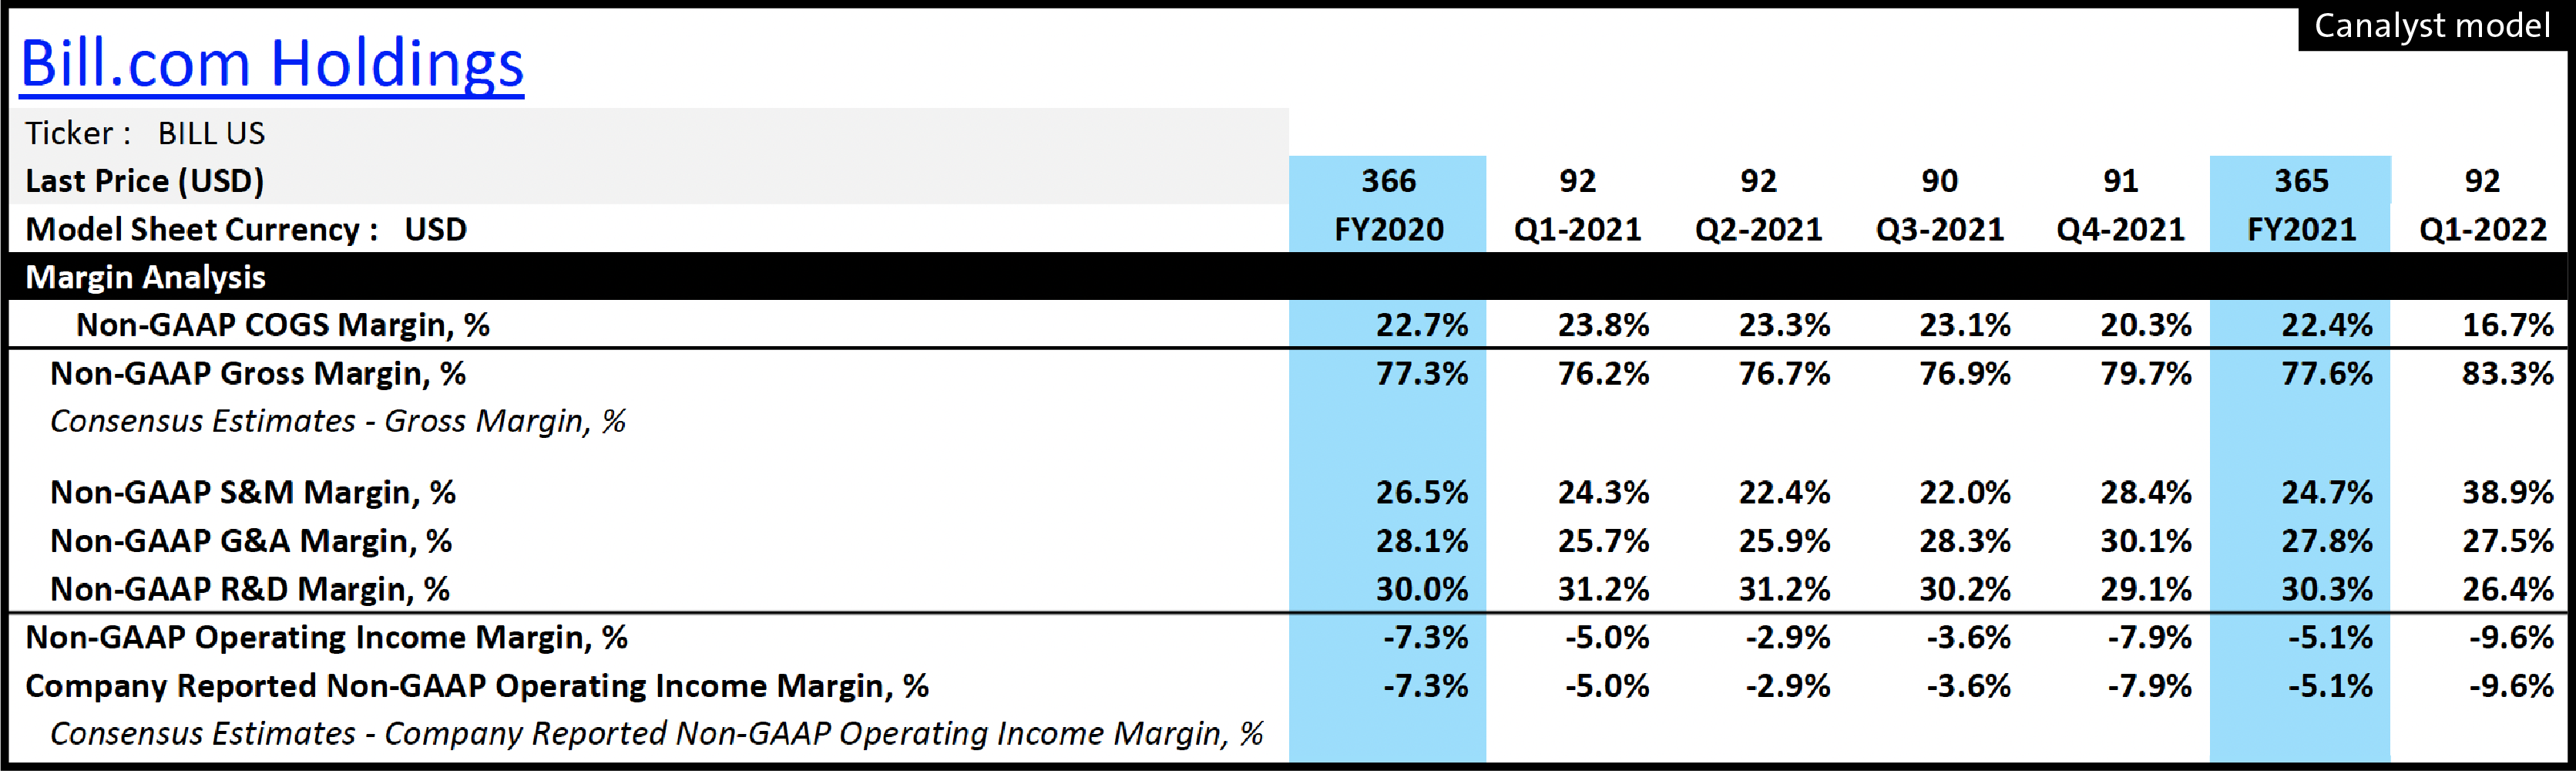
Non-GAAP gross margin was 83.3%, which was higher than 76.2% reported in Q1/21. Y/y expansion was driven by a higher mix of interchange and variable transaction revenue. Non-GAAP operating margin was down to -9.6% y/y because of investment in the platform and greater spending on expanding relationships with financial institutions and payment processors. Adjusted net loss beat expectations due to strong revenue and gross margin results, coming in at $14.1 million or $(0.15) per share.
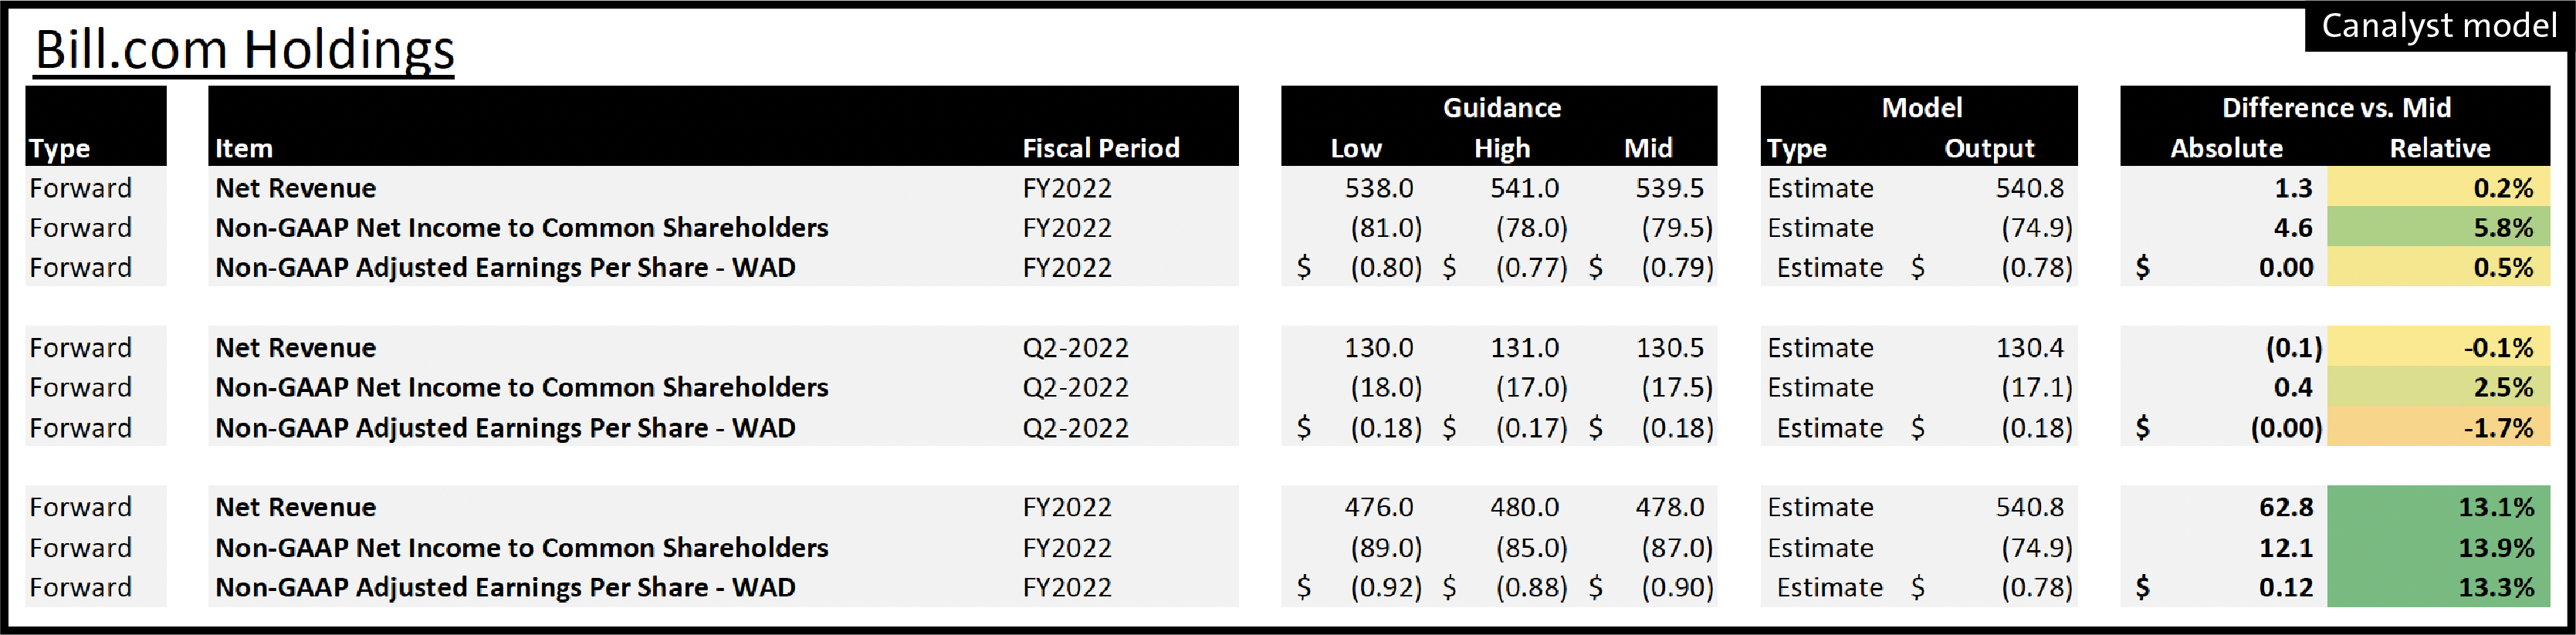
Alongside the quarterly results, the company raised its FY/22 revenue guidance from $476-$480 million to $538-$541 million and increased its adjusted EPS guidance from $(0.92)-(0.88) to $(0.80)-(0.77).
It will be interesting to see how it performs in the coming quarter given difficult comparison metrics, particularly TPV growth and growth of value per transaction. The Company posted TPV growth of 40.1%, 44.3% and 64.0% in Q2/21, Q3/21 and Q4/21 respectively. It is possible this growth will taper in Q2/22 when the spike the Company experienced due to SMBs getting back to more normalized business in Q2/21 will not occur this year. BILL’s take rate expansion could expand even further as the gross fee on Divvy’s and Invoice2go transactions are much higher than standalone BILL’s services.
BILL’s revenue trajectory could also benefit from a rising interest rate environment as that would help the float revenue which declined consistently throughout FY/21and Q1/22 due to low rates. 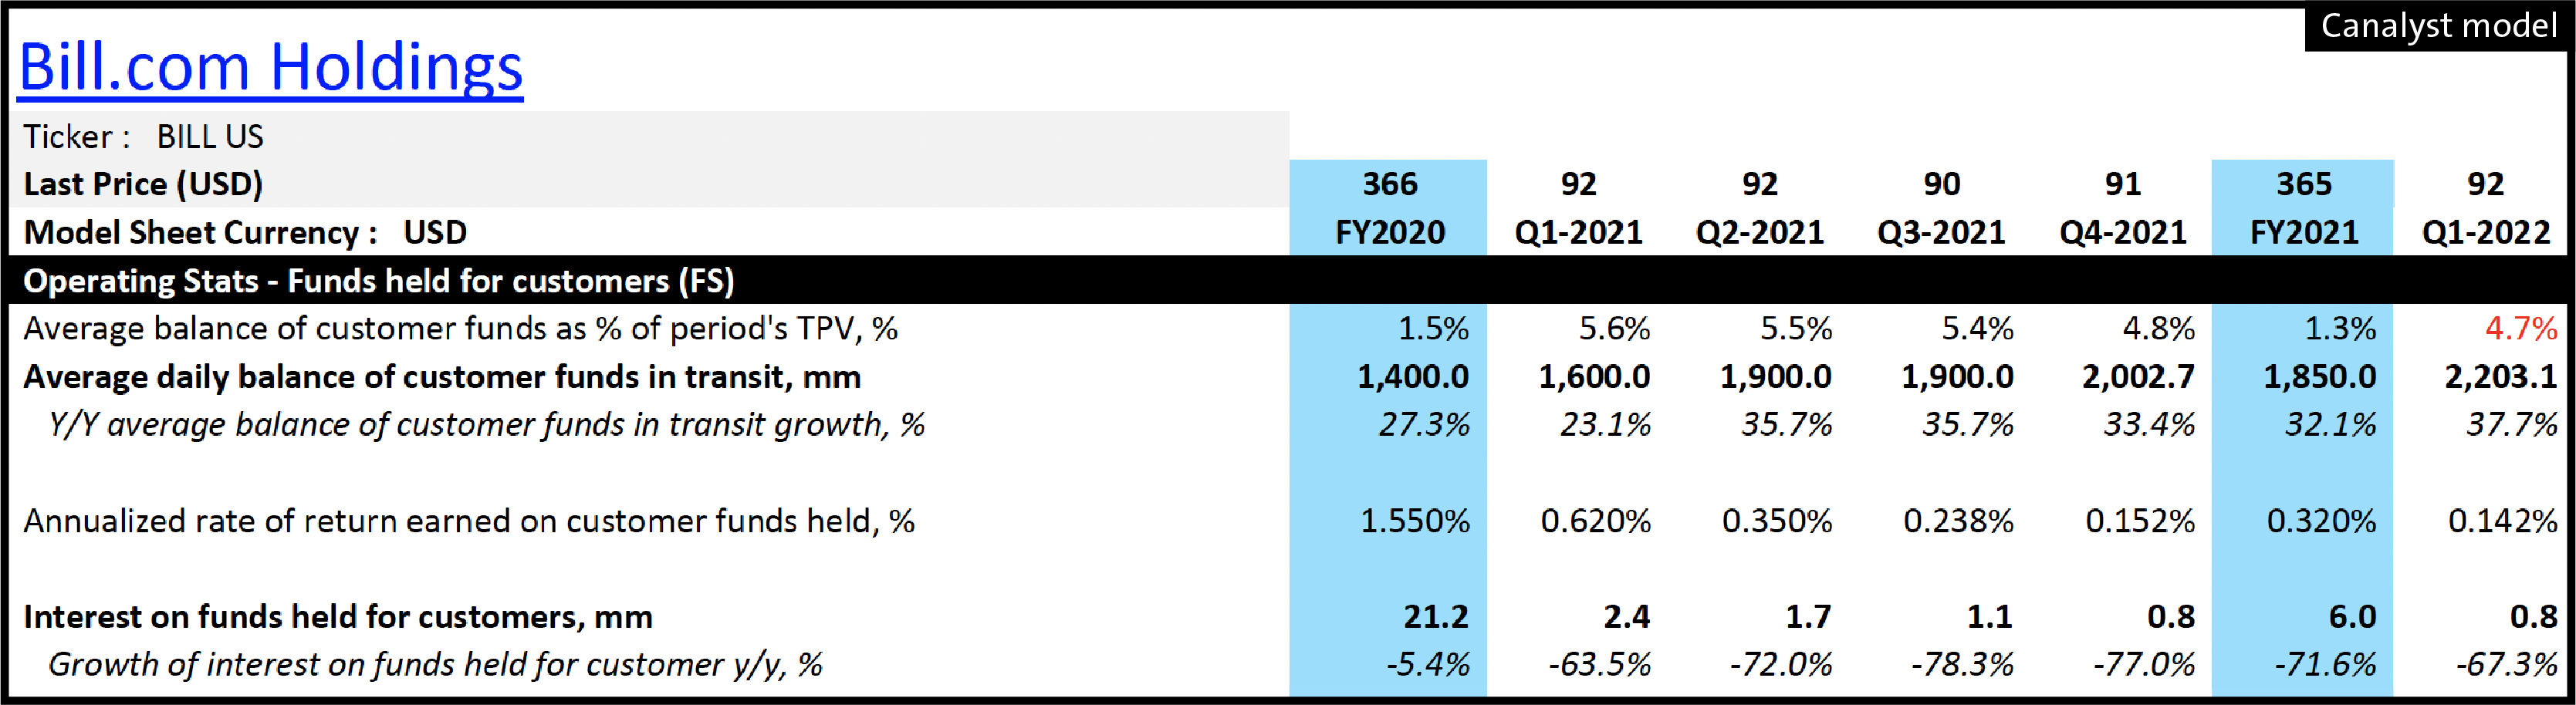
Dive deeper by downloading the Enterprise SaaS Dashboard directly from the portal now here, and see how BILL compares to 85+ other SaaS names.
Not yet a Canalyst client? Learn more with a demo of our 4000+ equity model platform today.