The following is an example of the use of Canalyst Fundamental Data using Candas, not intended to be a recommendation of action.
The Python Jupyter Notebooks supporting this analysis can be found at our Candas Github Repository.
Goldman Sachs (NYSE: GS) reported on January 18.
“On top of a weaker trading environment, generous compensation — the most costly expense at Goldman and other banks — has raised the ire of investors. Goldman’s compensation costs rose a whopping 33% to $17.7 billion in 2021, signaling big bonuses for a record year. But concerns about rising operating costs helped push JPMorgan shares down 6.2% on Friday, their most in over 18 months. Goldman didn’t fare any better, falling 8% on Tuesday, also the most in 18 months.”
– Motley Fool
Consensus opinion suggests that compensation pressure would be endemic to the brokerage industry after JPM and GS results.
In this brief report we re-drive the brokerage industry models based on GS results and outline some surprising conclusions testing the compensation ratio read-across for the brokerage sector: Morgan Stanley (MS), Evercore (EVR), Piper Sandler (PIPR), and Stifel Financial (SF).
Observations:
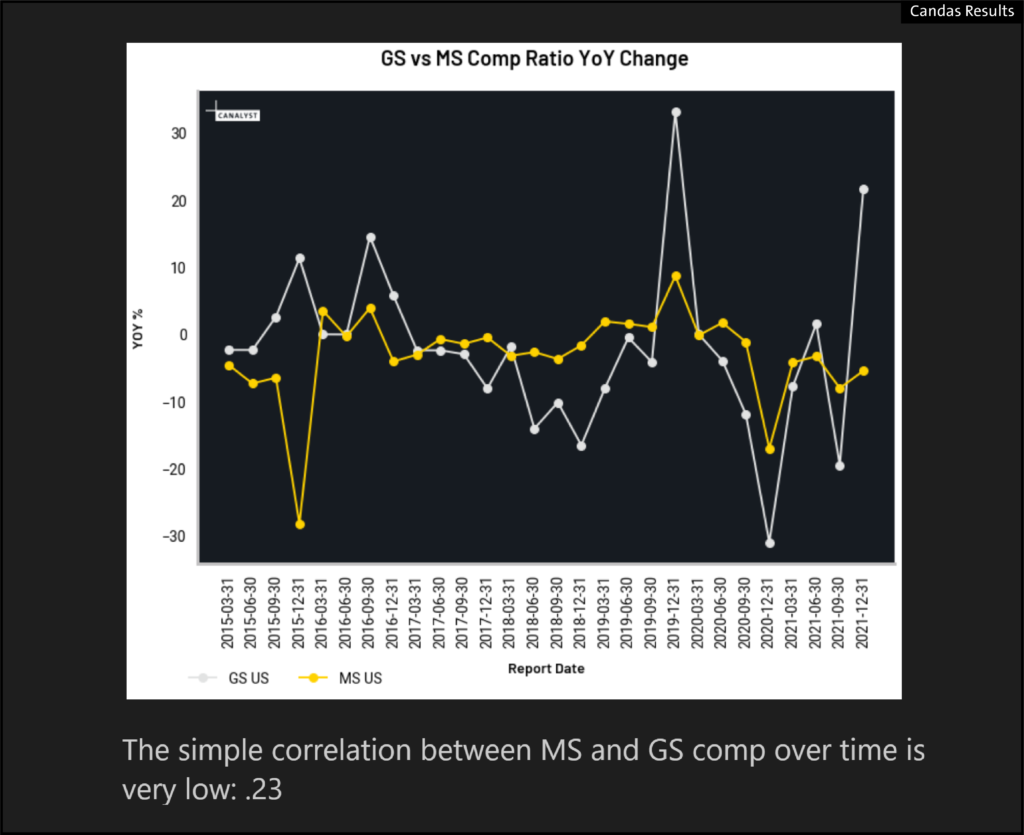
- The time series Compensation Ratio has a very low correlation among the brokers, so any read-across based on this time series is highly unreliable.
- MS reported earnings this morning, and using that result we saw a mere .23 Correlation. The following chart highlights the issue at GS:
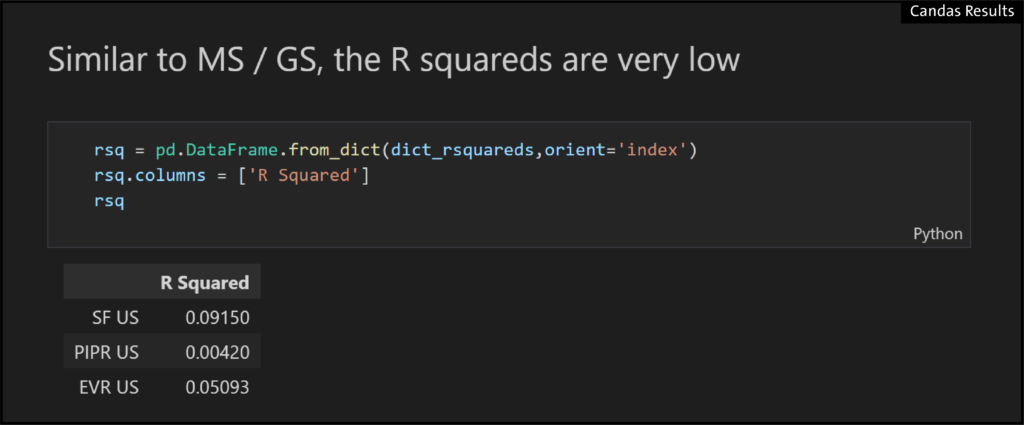
- When we apply the GS Compensation Ratio to the rest of the brokerage universe we similarly see very low r-squareds in the regressions:
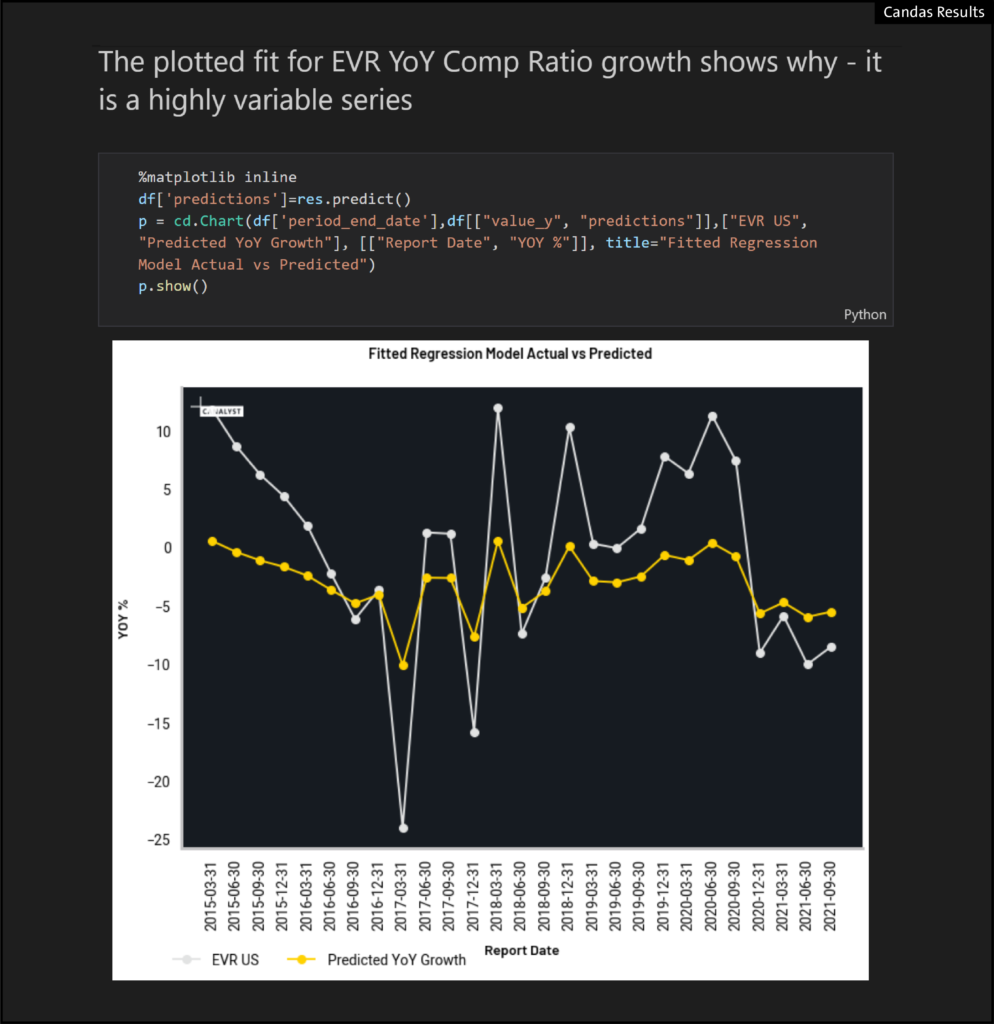
- As can also be seen by the chart of the fitted regression model GS vs EVR actual EVR vs predicted:
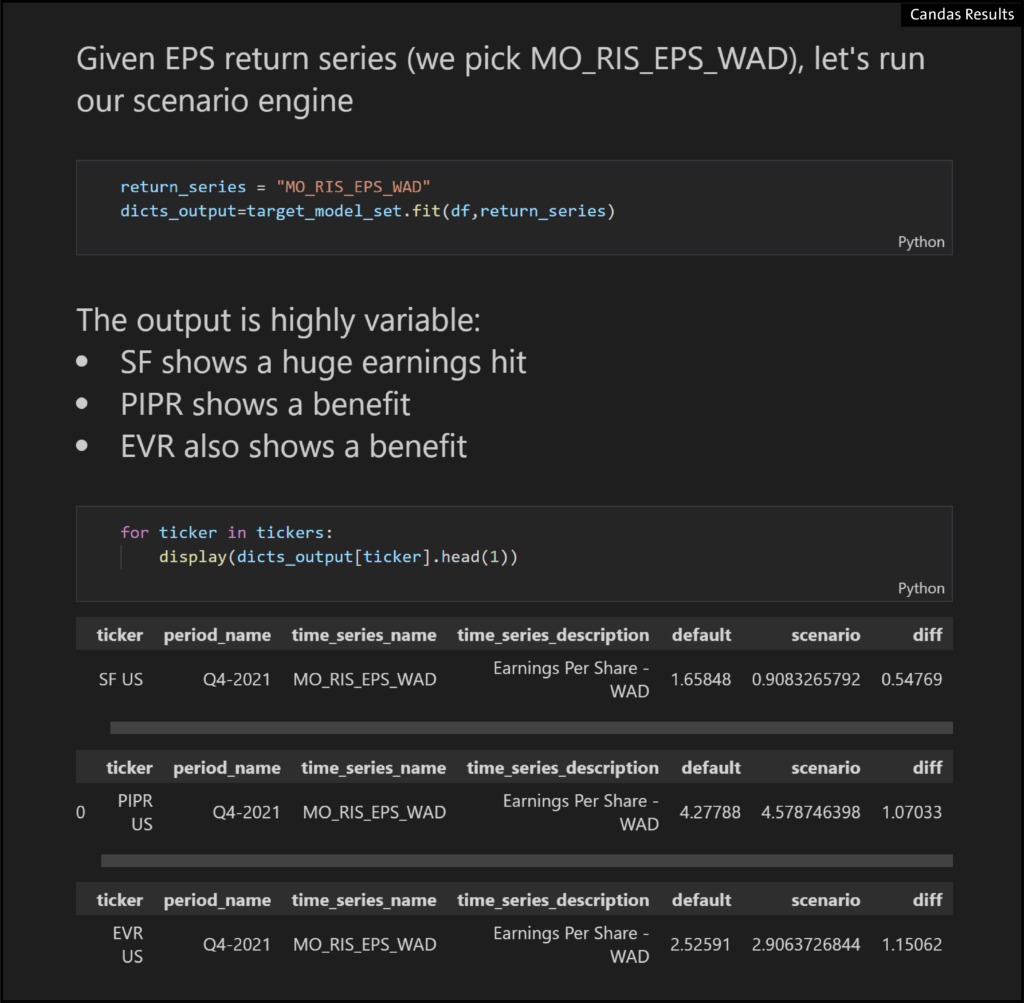
- We can set new values from regressions and use the fit() function to redrive the models
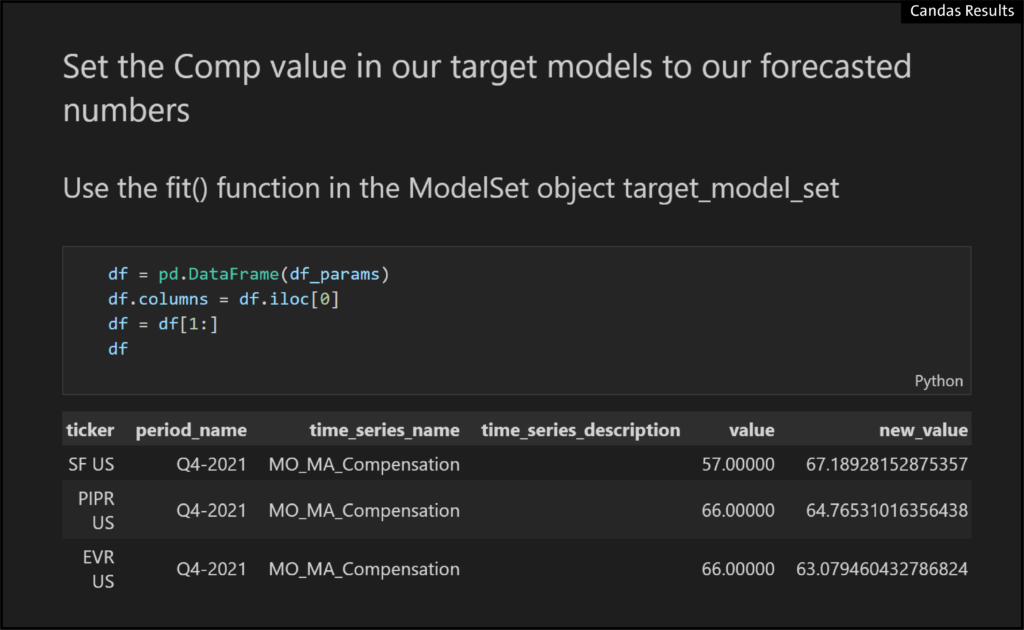
- And the output is highly unclear, because the fitted model suggests different directions
Conclusion
Compensation ratio is not a good read across between brokerage models. The conclusion from JPM and GS – that compensation ratios must head higher industrywide – is not supported by either a regression analysis of comparable KPI nor by re-driving the models based on GS results.