The following is an example of the use of Canalyst Fundamental Data using Candas, not intended to be a recommendation of action.
The Python Jupyter Notebooks supporting this analysis can be found in our Candas Github Repository.
JPMorgan Chase & Co. (NYSE: JPM) reported Q4 2021 earnings on January 14. Historically, it has been the first money center bank to report earnings. Given that it is a money center bank, JPM touches on many subsectors within financials such as:
- Card Processing (V MA GPN)
- Credit Cards (COF DFS AXP)
- Capital Markets (GS MS)
- Securities Servicing (STT BK)
Consensus opinion holds that these stocks should trade on their corresponding line items from JPM.
To see our pre-earnings read-through analysis of JPM and its KPI correlations with card processors, credit card companies, and brokers, head to Part 1 of this blog to explore more.
In this brief report we outline some conclusions for American Express (NYSE: AXP) based on JPM Q4 results.
TLDR Conclusion:
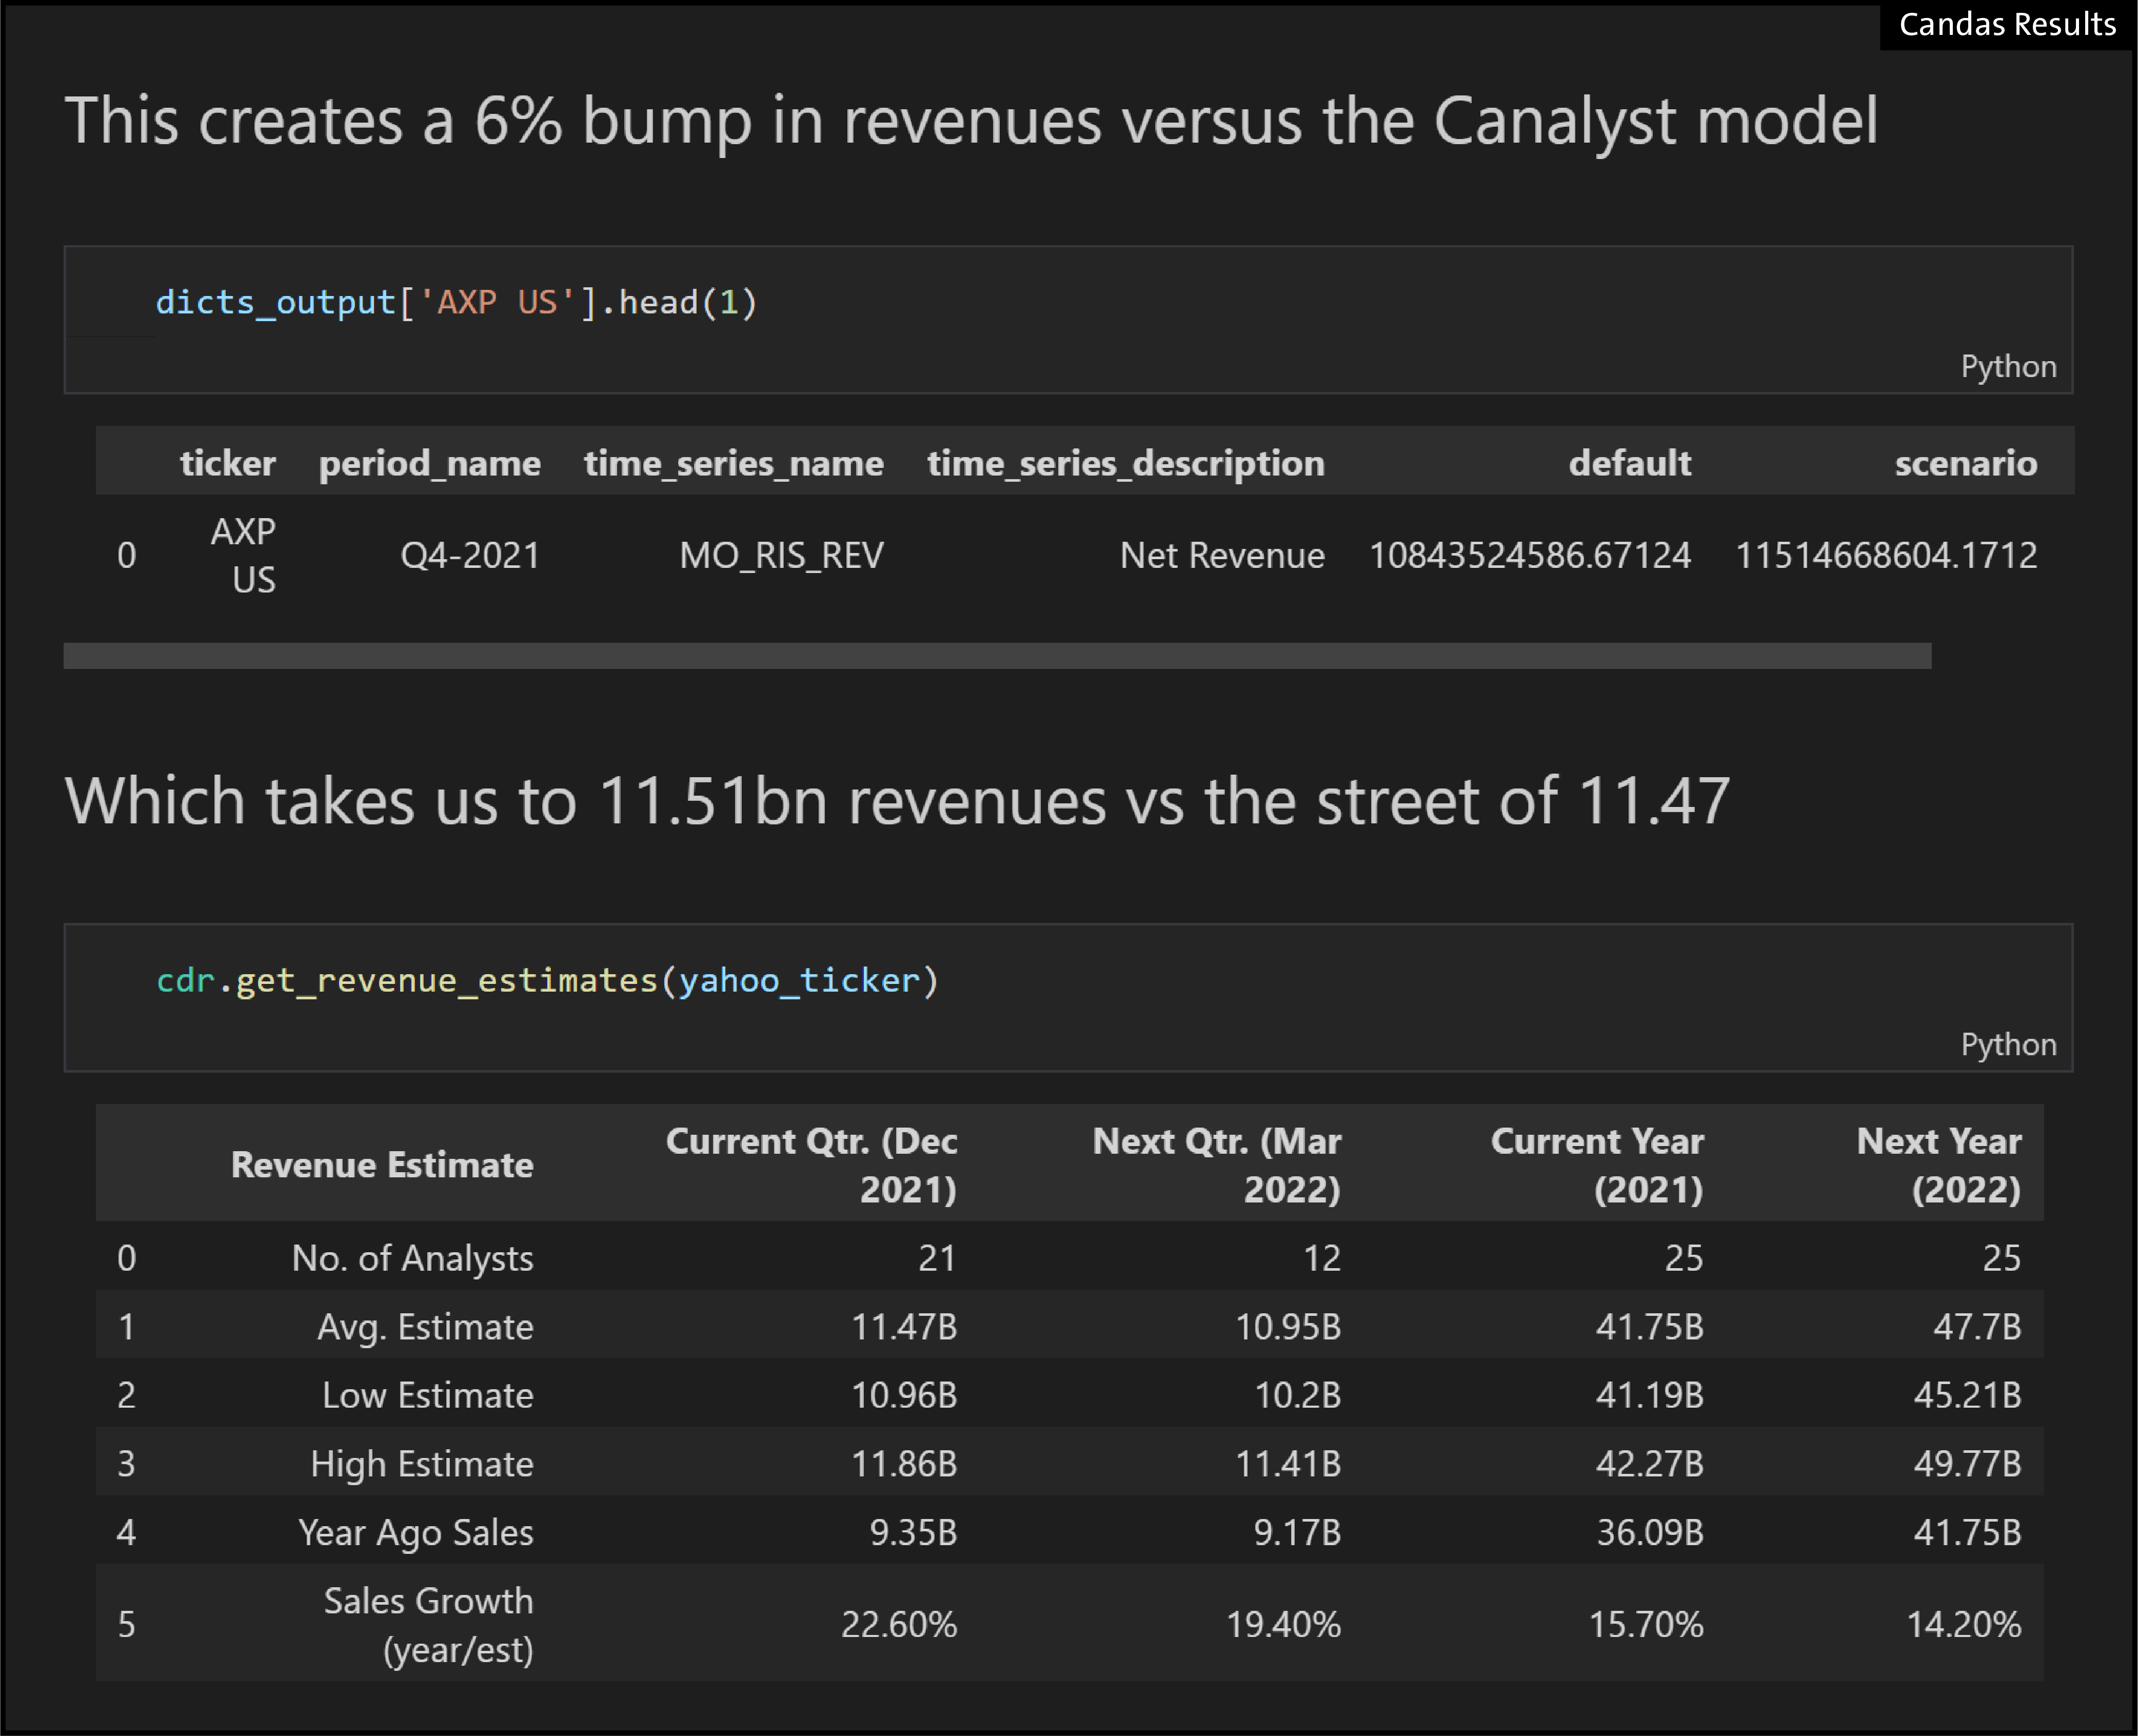
- JPM results caused us to revise our AXP revenue estimates upwards by 6%.
- We are now slightly ahead of the Street.
- AXP tends to beat earnings, however AXP stock tends not to show subsequent alpha, on average, over 52 observations.
- It is likely that buyside estimates tend to sit higher than Street estimates for this company, on average over time.
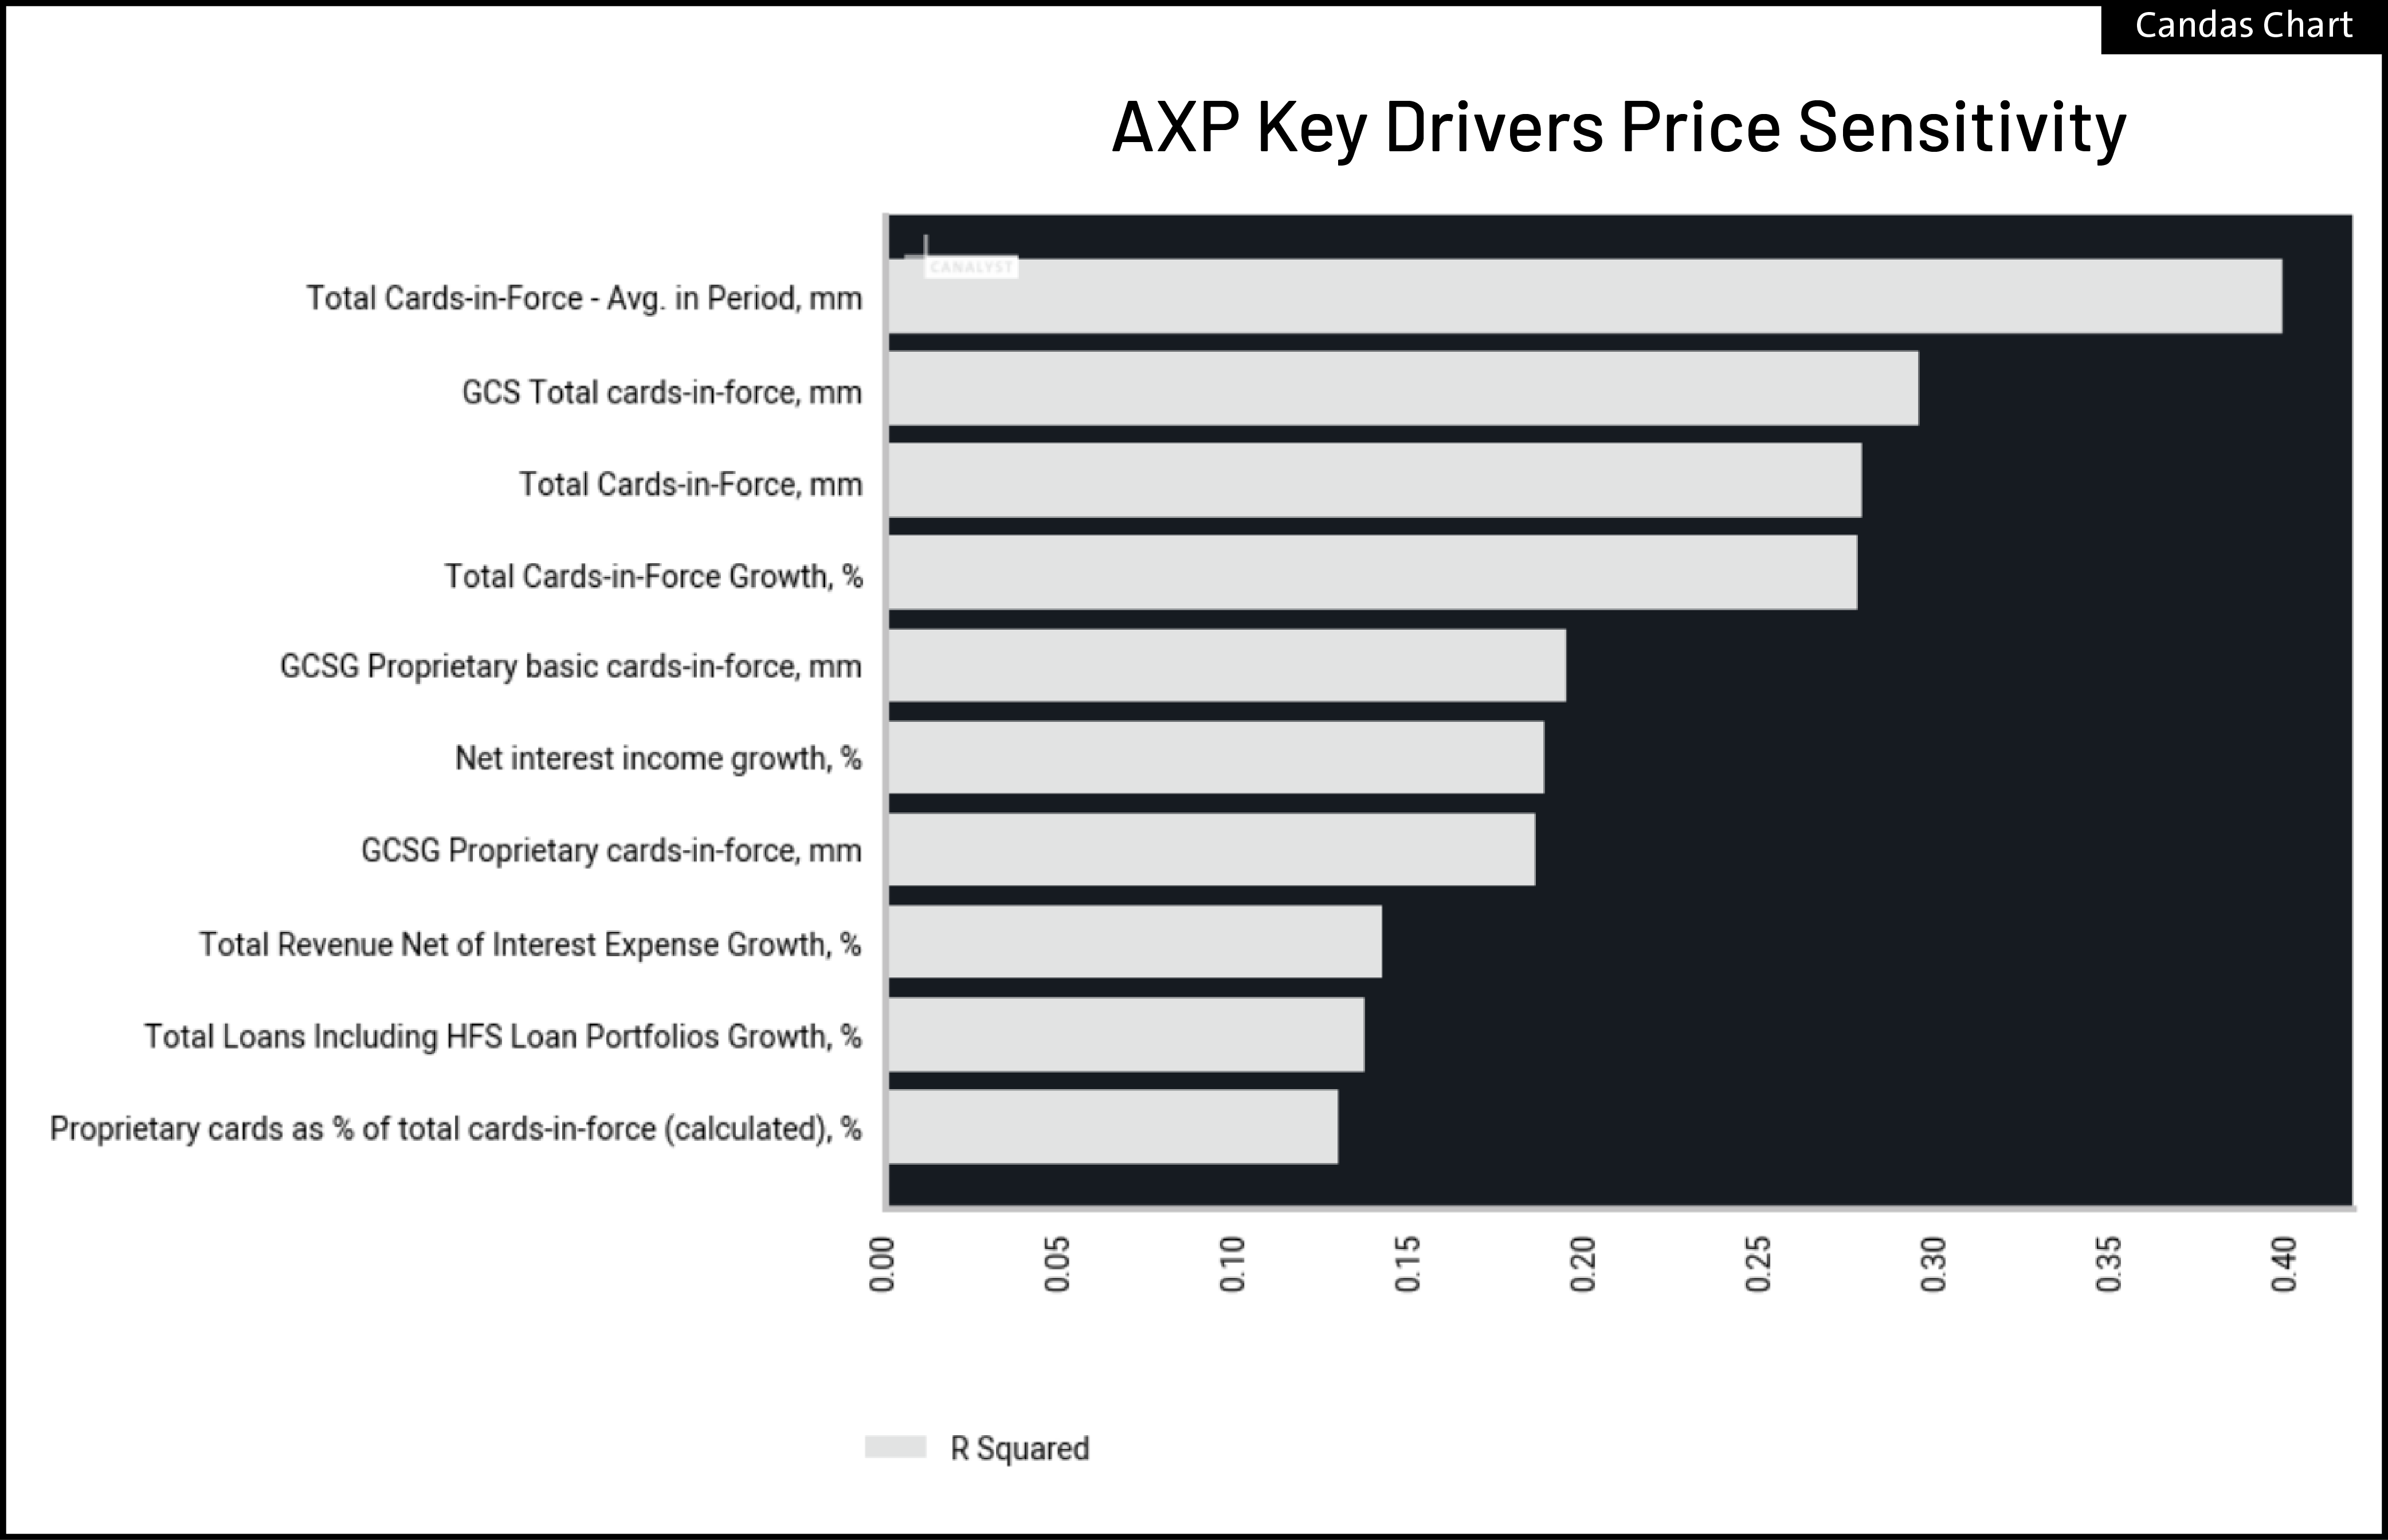
- One surprising caveat is that based on our key KPI analysis, AXP historically tends to trade more on Cards in Force than Volume.
The six steps we took to get to our revenue conclusion:
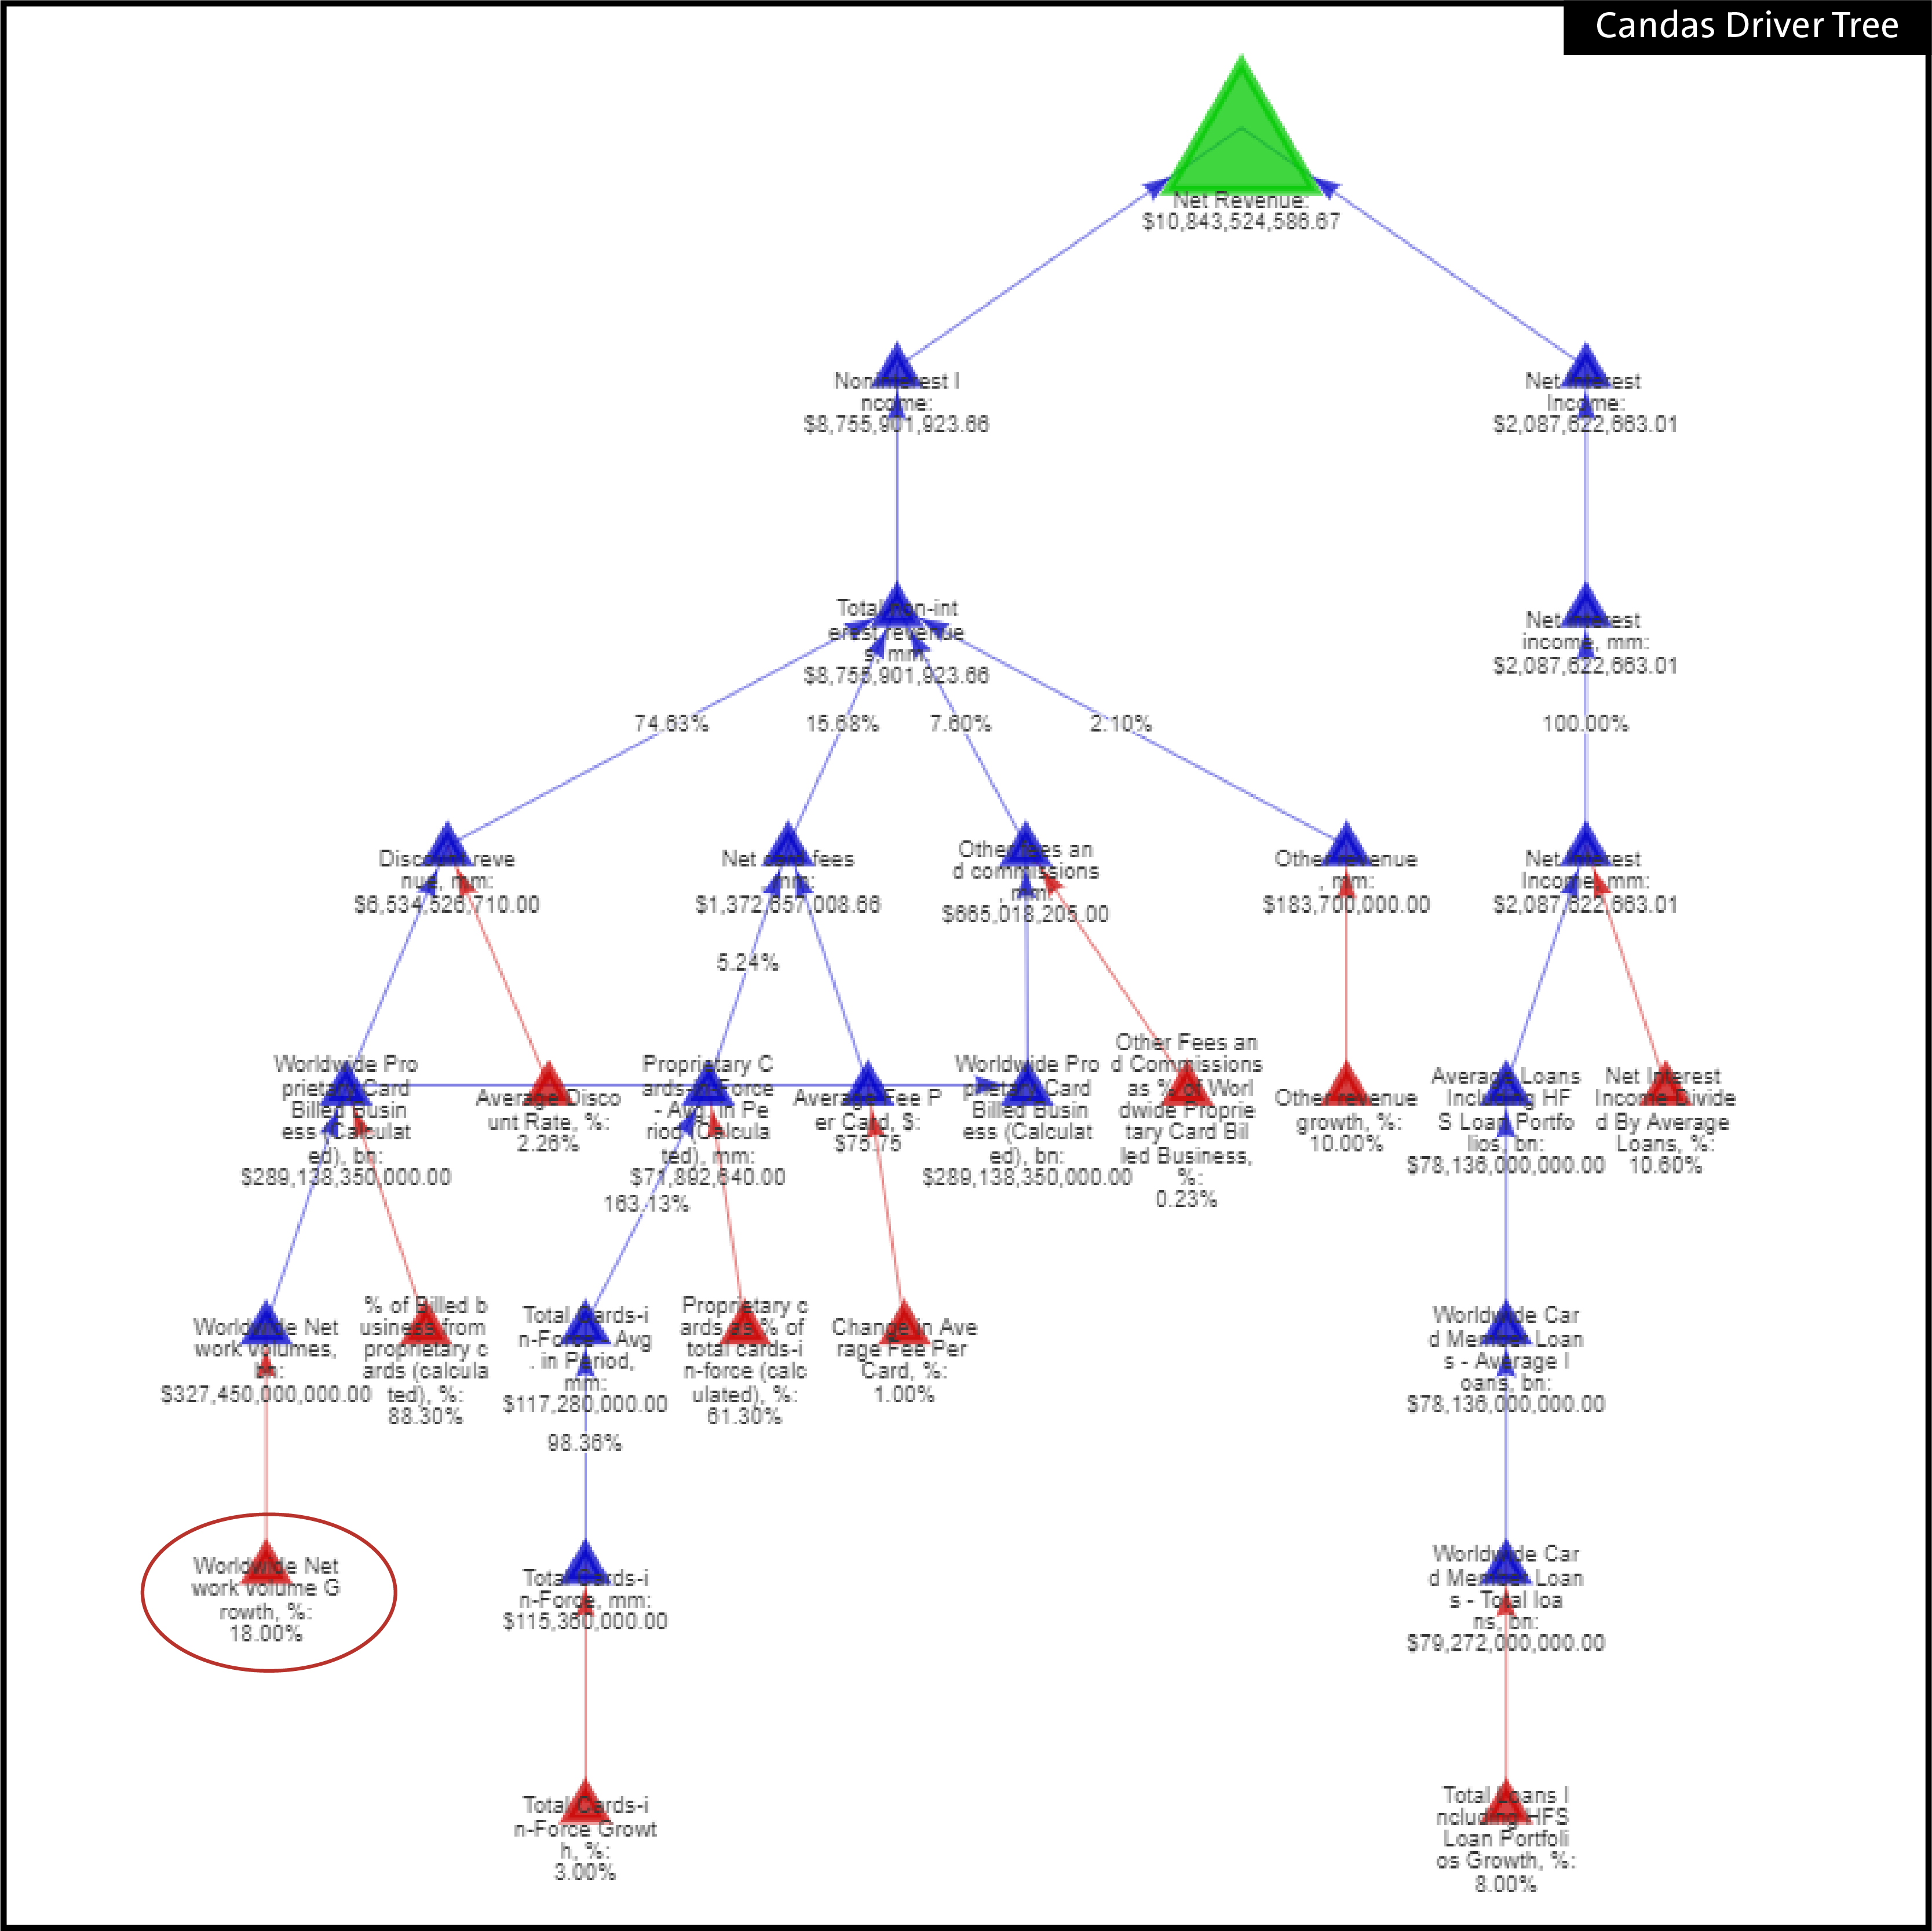
01 – Use the Candas ModelMap of AXP to find a likely KPI pair candidate, in this case “WorldWide Network Volume Growth”
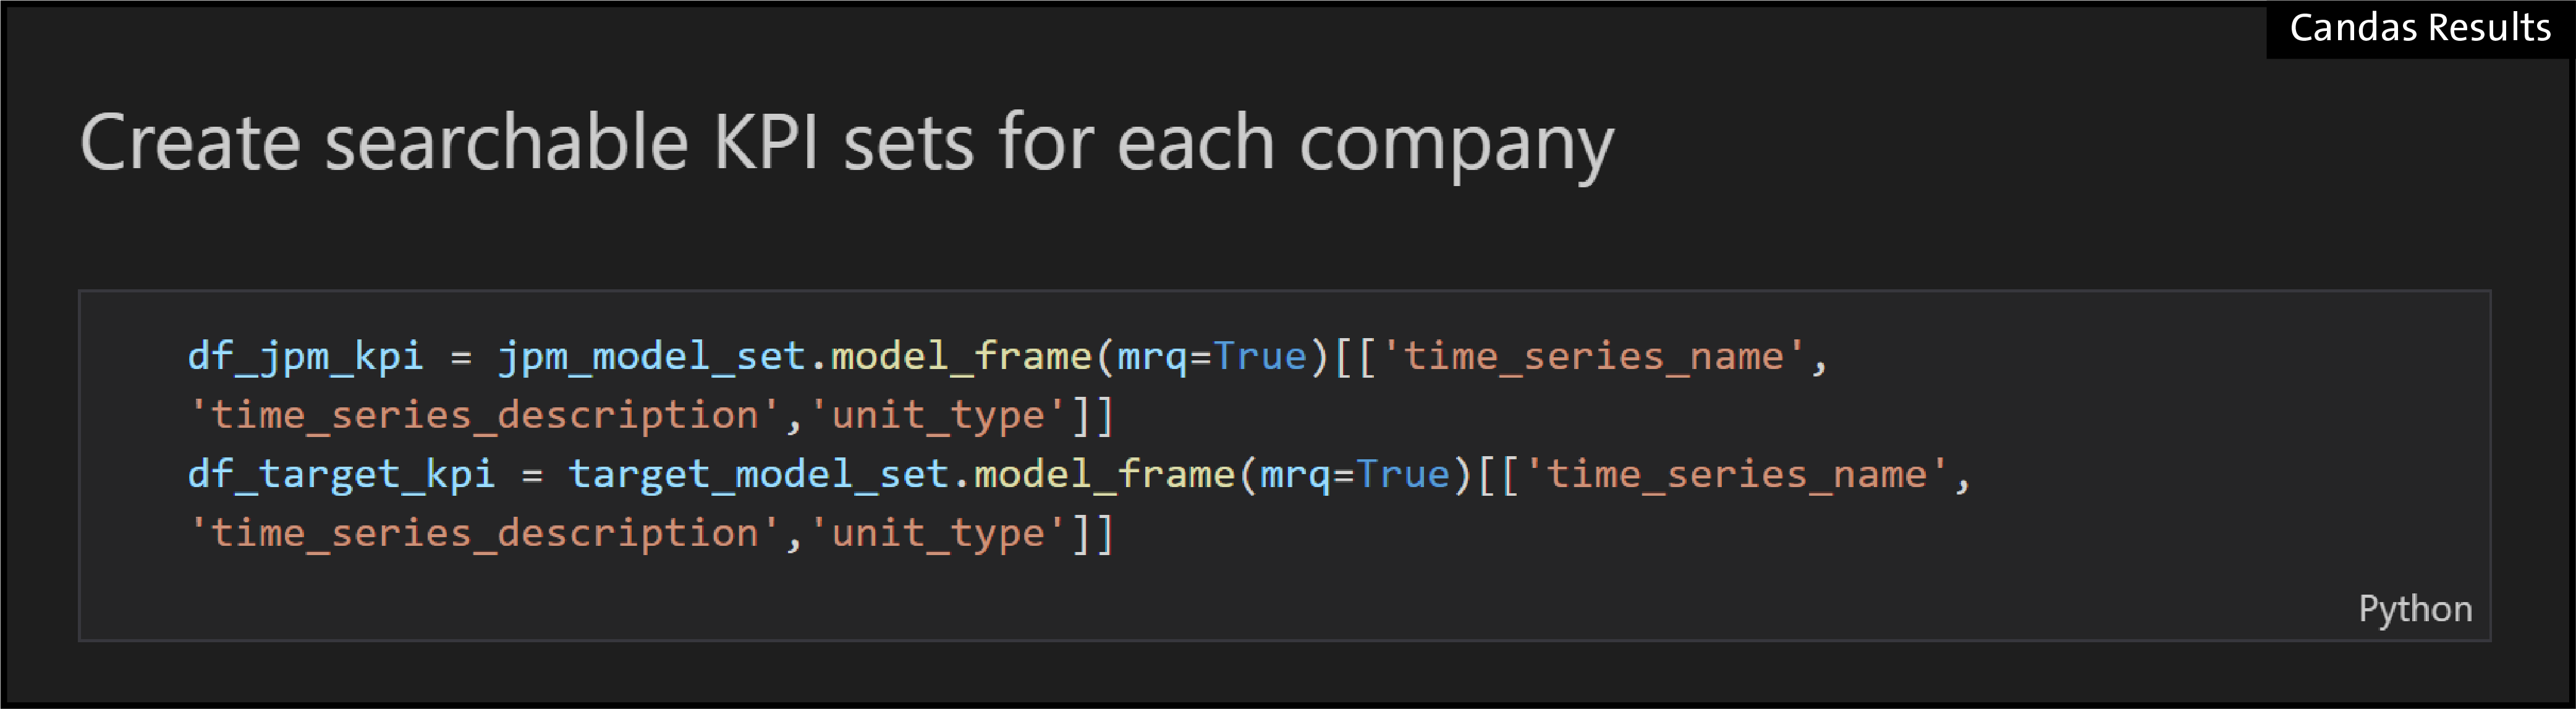
02 – Create a dataset from each (JPM and AXP) model:
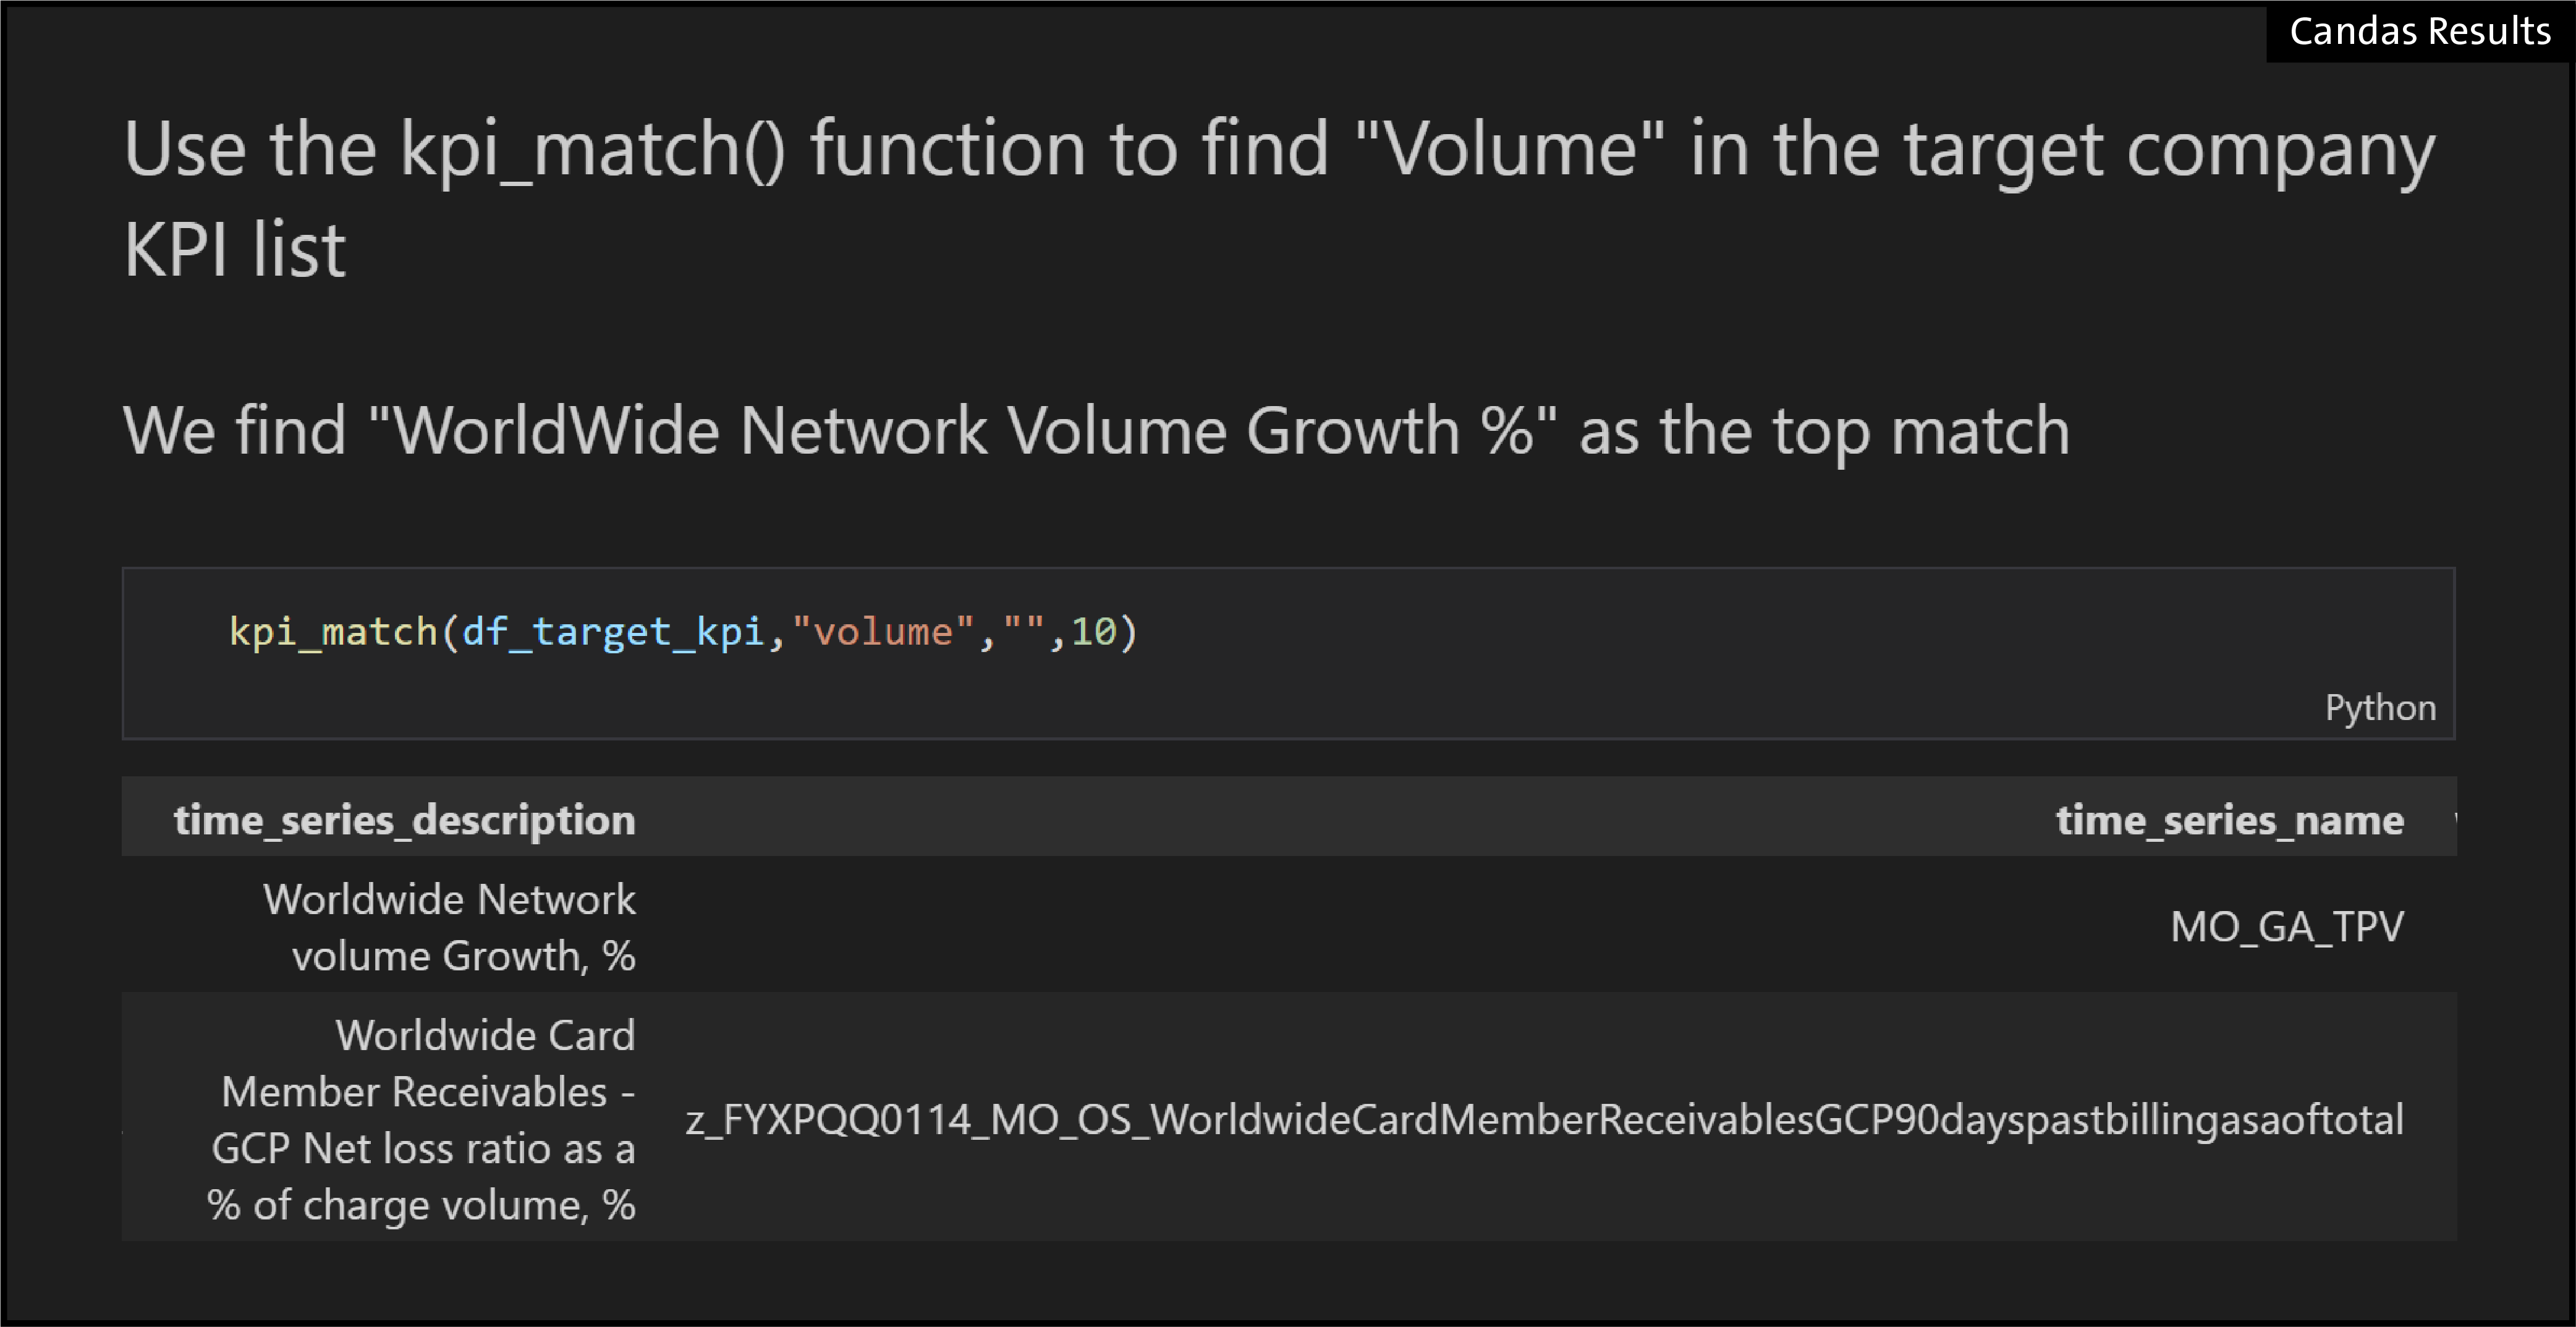
03 – Find the model-specific “time series name” for WorldWide Network Volume in AXP using the kpi_match() function:
04 – Having created a dataframe with our paired series (using Credit Card Sales Volume from JPM as highlighted in our previous report titled “Observations on Traditional JP Morgan Read Through”):
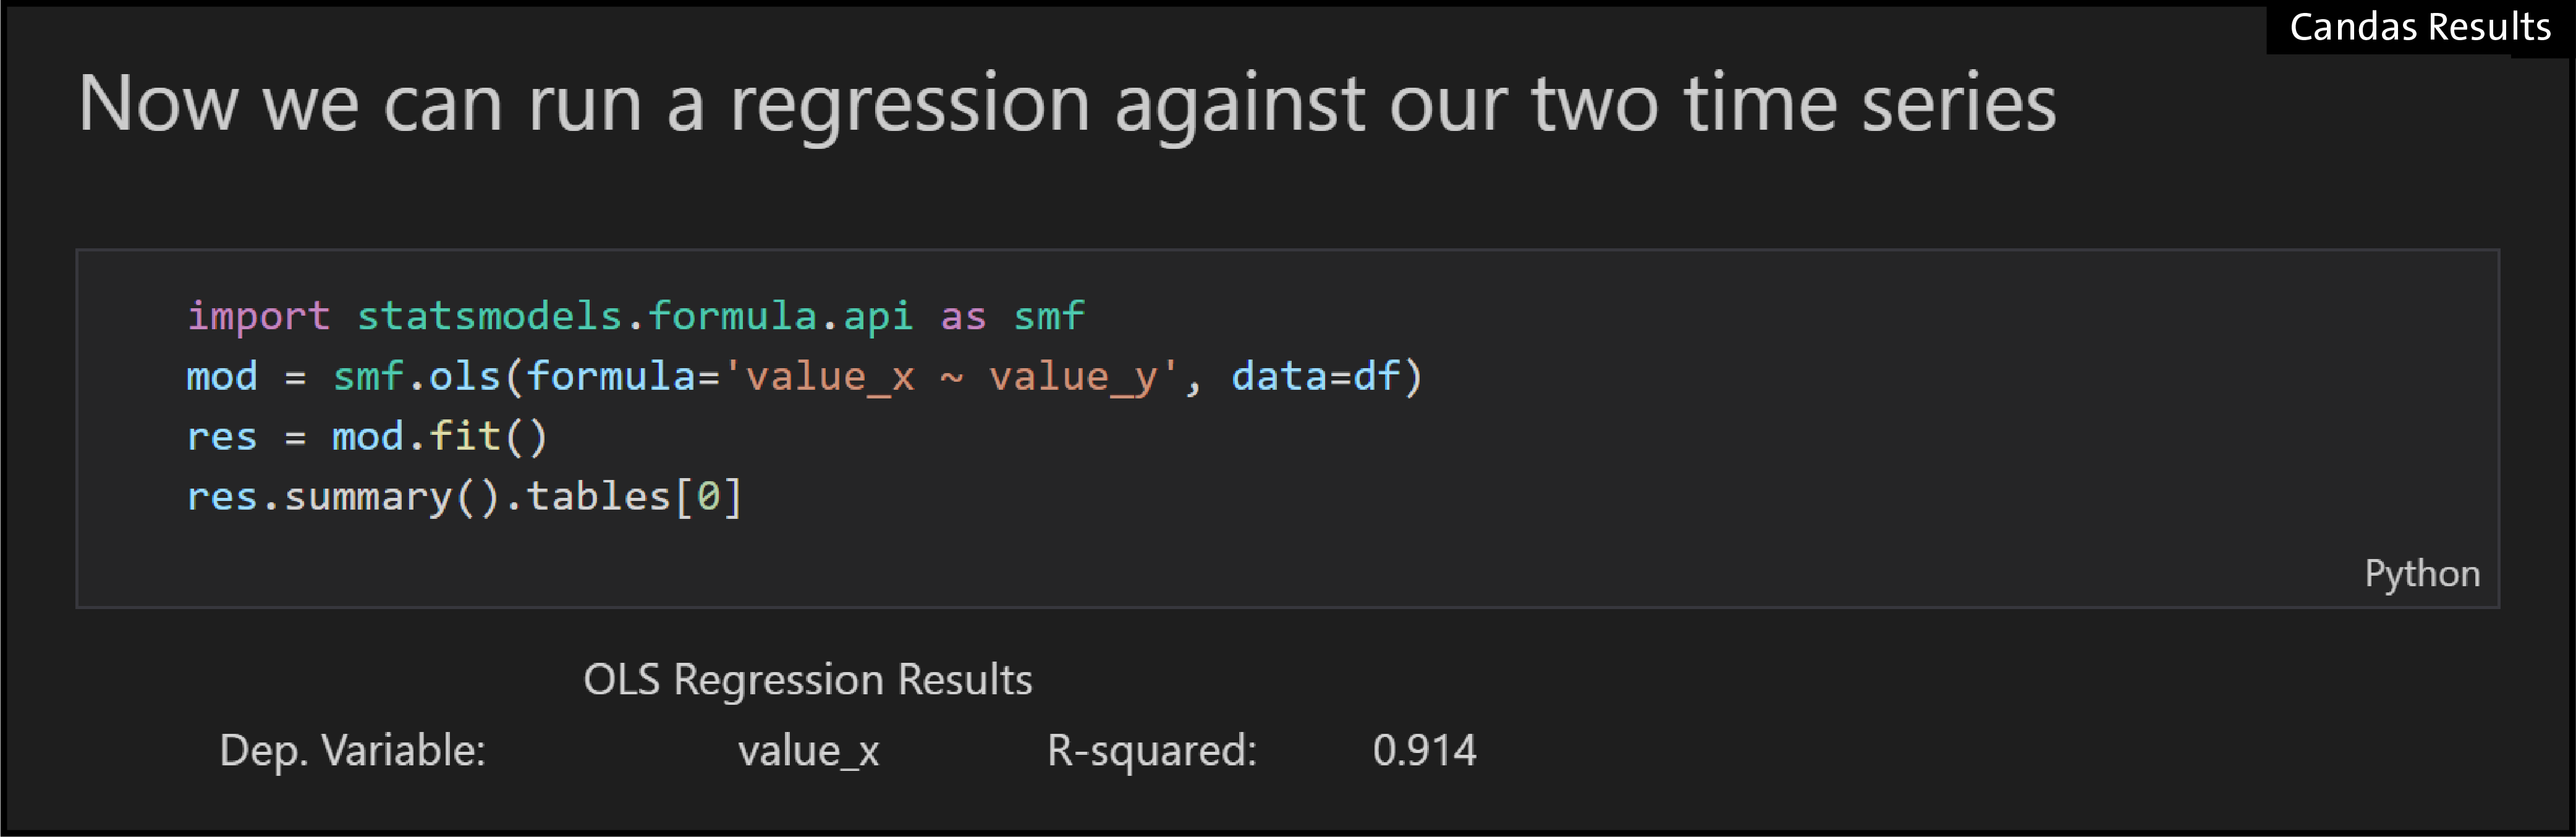

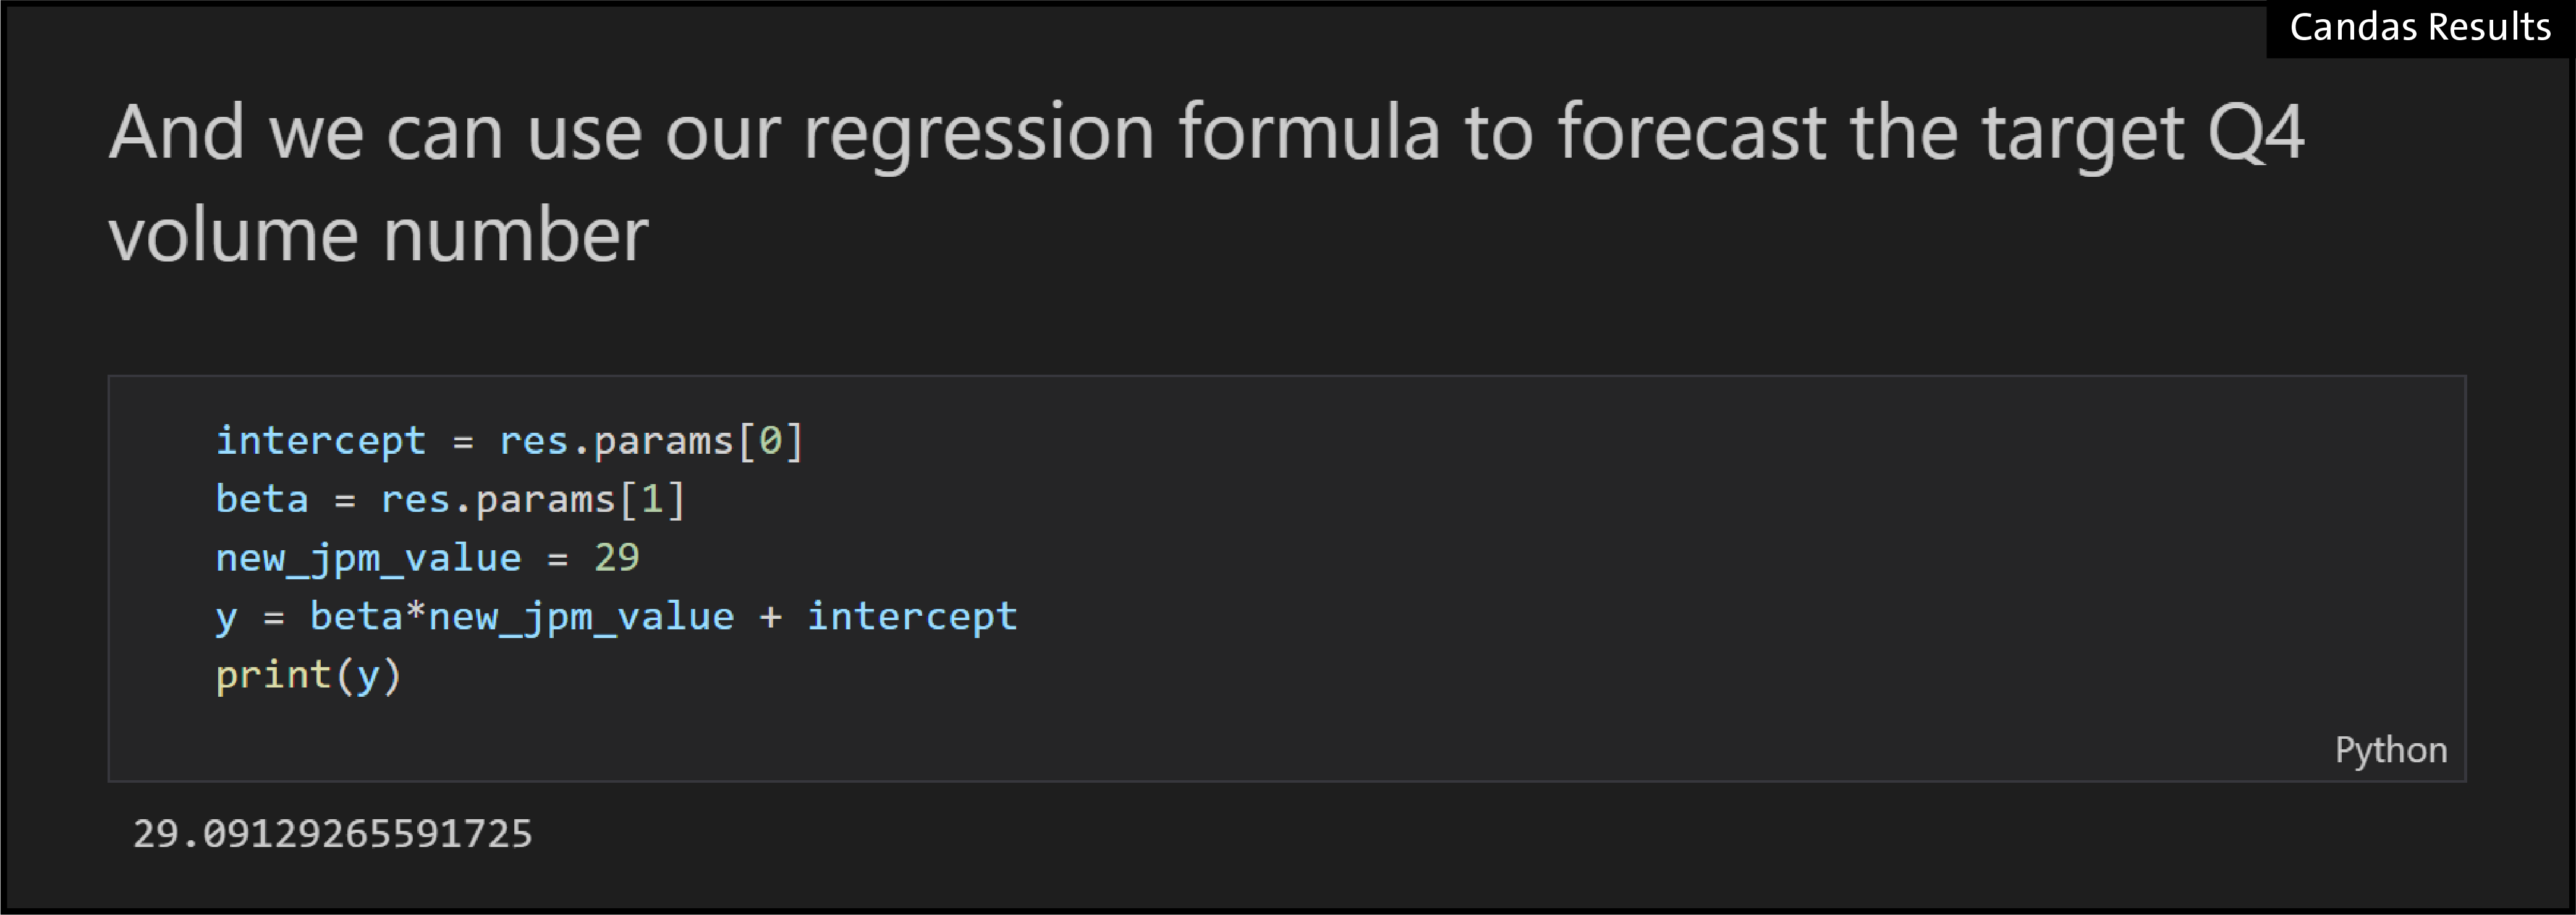
05 – RSQ of .91 and a good fit – we then use that regression formula to forecast AXP based on JPM for Q4
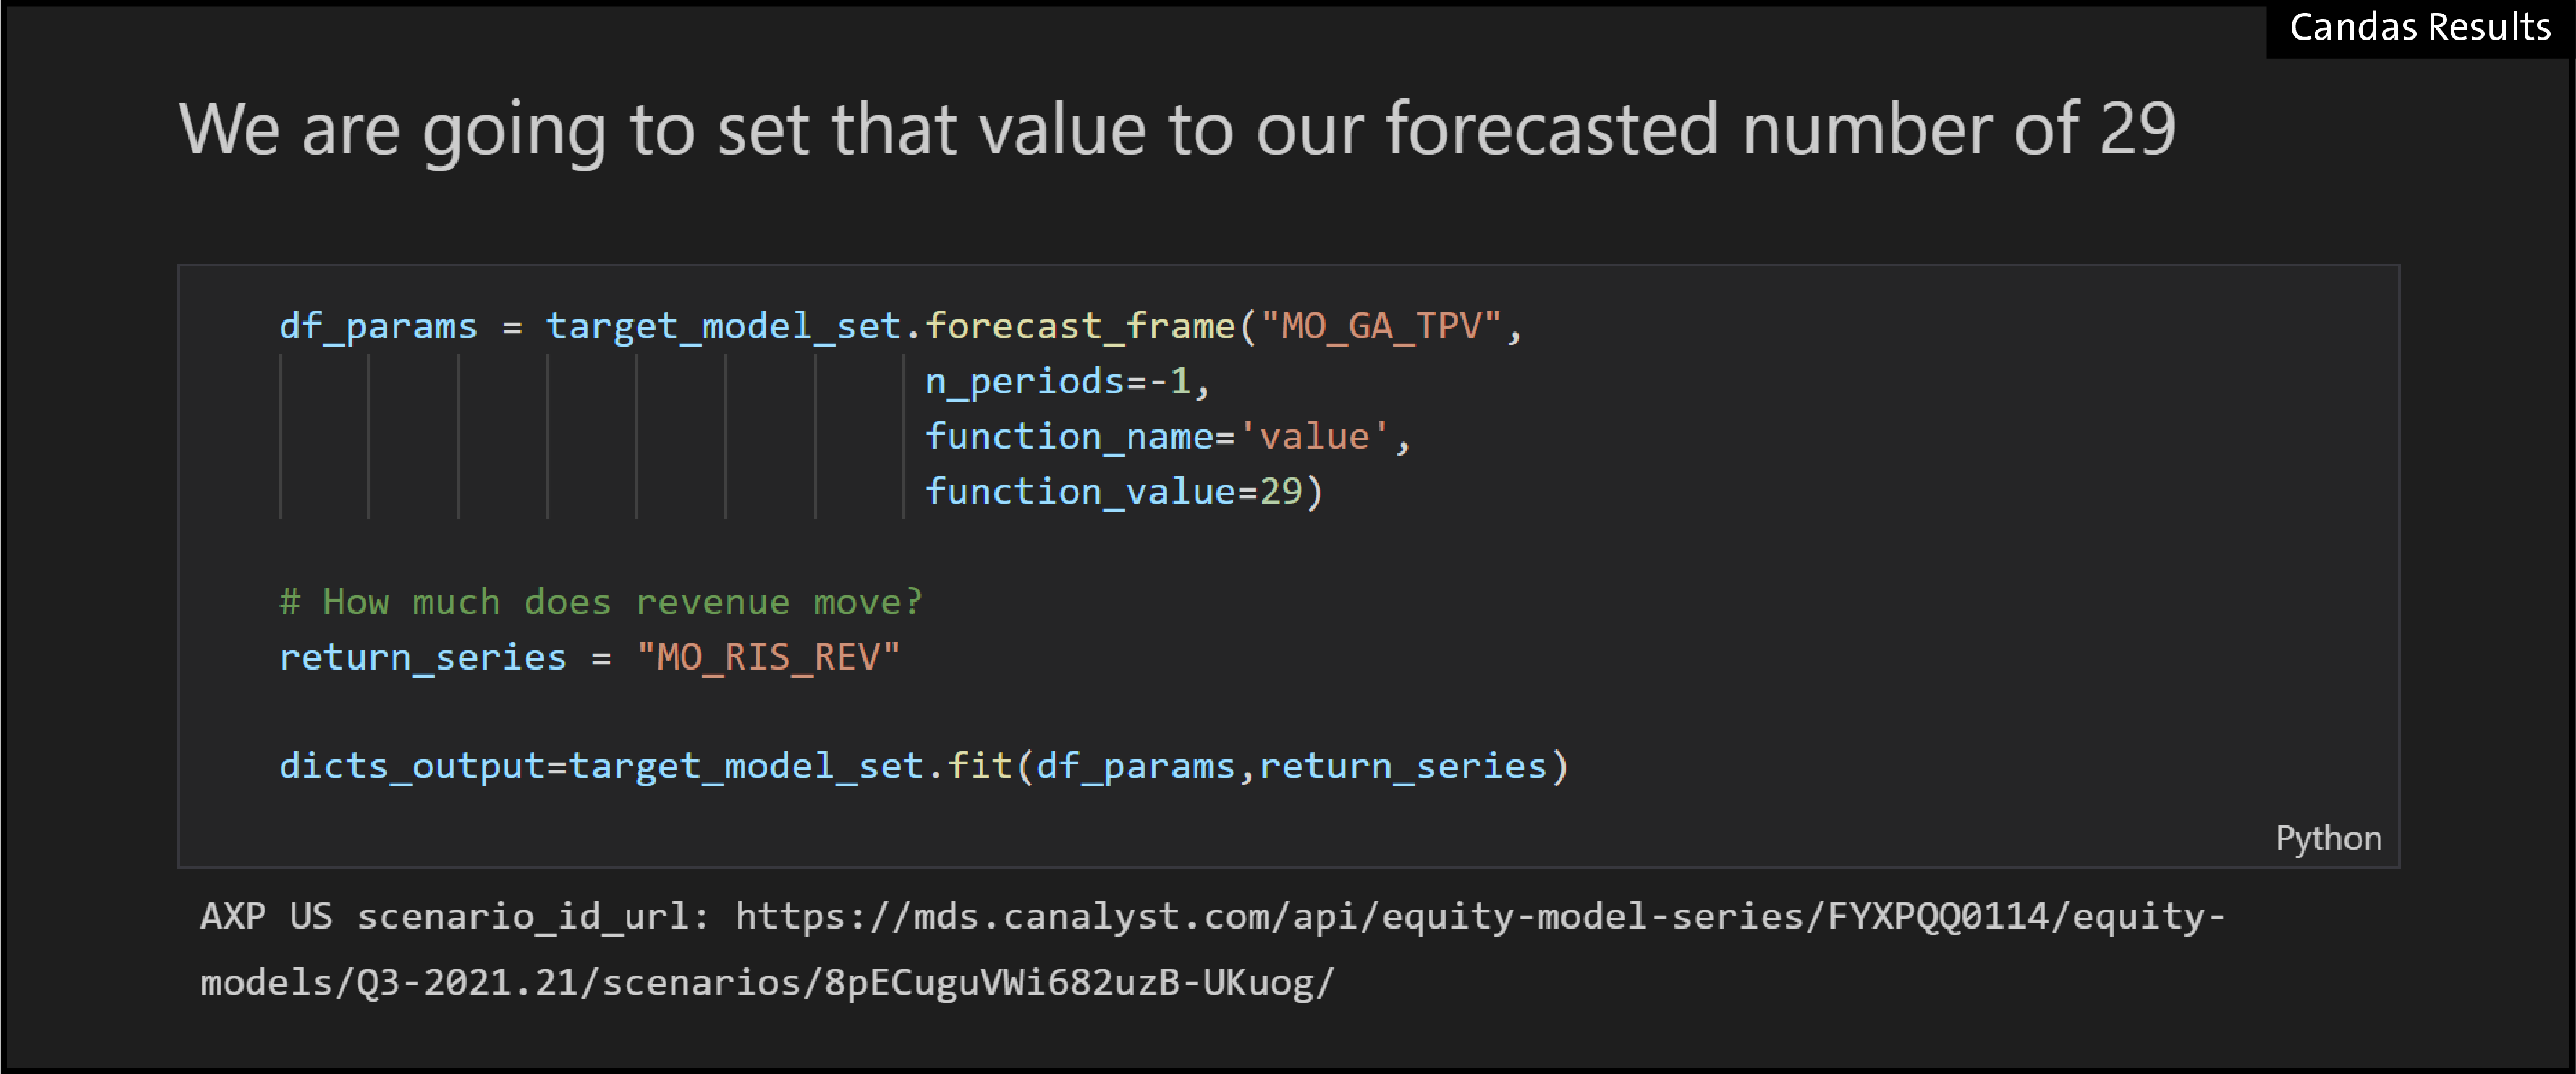
06 – Now we re-drive the AXP model with this new number for Q4
Conclusion: Our revenues bumped 6% higher, and took us slightly over the Street for the quarter.
Caveat: AXP stock appears to trade more on Cards in Force than network volume, though the R Squared is probably too low to be conclusive.
Using the Candas Data Science Library, you’re able to perform a host of similar analyses in a quick and timely manner. Instead of having to build and clean models, start directly with updated Model Objects sourced directly from Canalyst, and get to the answers you want, faster. Whether it’s an ad-hoc analysis on company earnings, idea gen, or automated portfolio analysis, Canalyst’s Candas can help you get it done more efficiently.
If you’d like to explore Candas in more depth, request a demo today, or check out the Github for more usage examples from Candas creator, Jed Gore.