The global pandemic that caused the deep economic contraction in 2020 was the first real test for many SaaS software vendors. In a large part, these are rapidly growing companies that have never experienced a recessionary scenario. That made it difficult for investors to anticipate and model the impact on the underlying fundamentals. Having gone through the crisis, we gained more confidence in using selected financial disclosures to track the performance of this sector. It turns out that some key metrics are as useful during a crisis as they have been through the entire macro cycle.
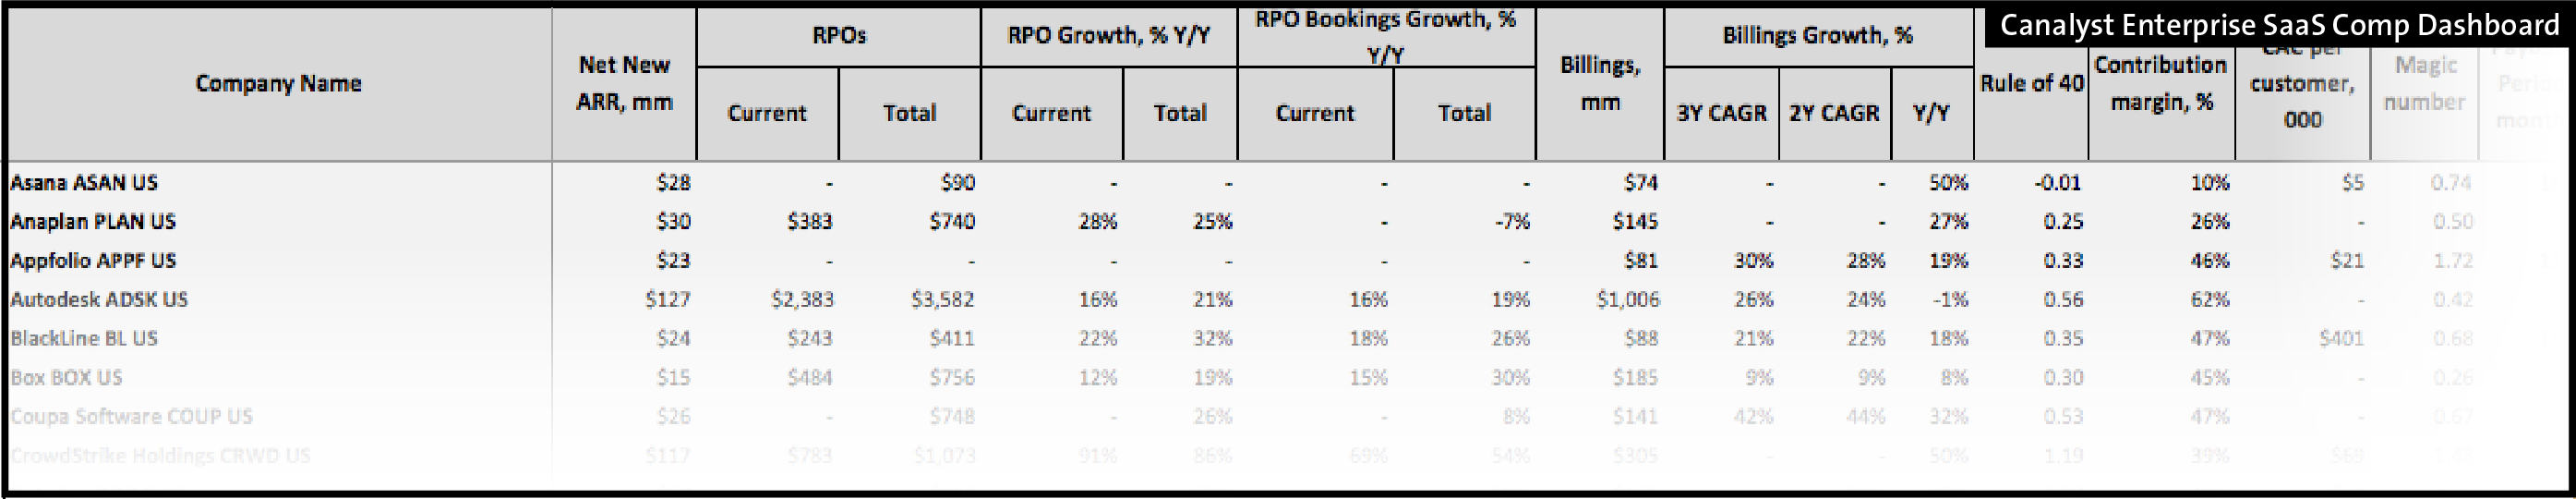
As a result, we published a dashboard of SaaS metrics that collectively enhance the fundamental analysis of SaaS companies. They include the data that help analyze single-company fundamentals and track relative performance. Below, we recounted the value we derived from collecting such metrics through the recent period of volatility, as well as from years of following this space.

Insight when visibility is scarce
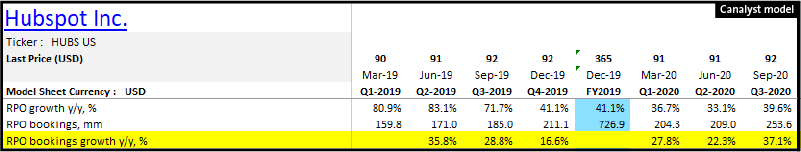
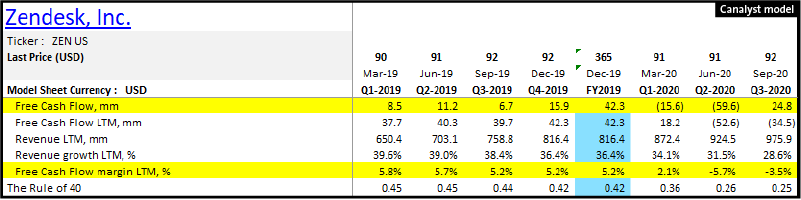
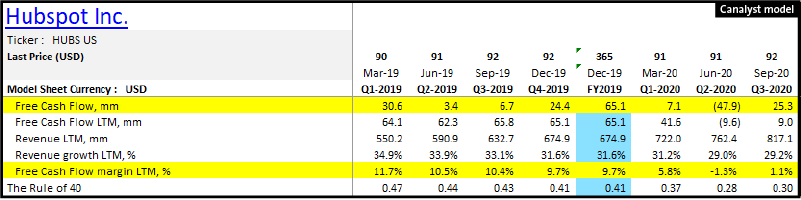
At the outset of the 2020 pandemic crisis, Customer Relationship Management (CRM) names were particularly vulnerable. The budgetary contraction on Marketing and Ads spend (Google [NASDAQ: GOOG]: Q2’20 revenue was -1.7% y/y) led to relative underperformance in H1’20. Names like HubSpot Inc. (NYSE: HUBS) and Zendesk Inc. (NYSE: ZEN) reported a widening delta between revenue and billings growth through Calendar H1’20.

But, the degree of revenue deceleration did not fully reflect the true demand contraction. The delayed effect of ratably recognized revenues booked as far back as 3-4 quarters ago understated the impact companies experienced in H1’20. Alternatively, billings, which reflect the ability to invoice customers and collect in the given period, slowed much more rapidly and allowed a closer reflection of the end market dynamics.
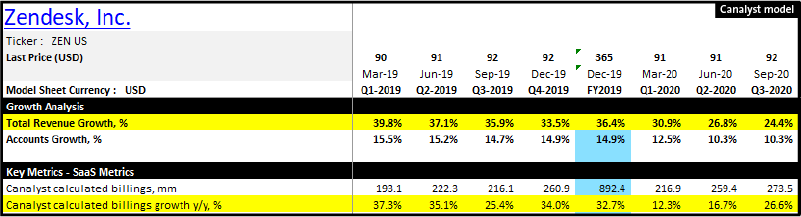
We found that changes in billings more accurately reflected what some of the affected names reported: longer sales cycle, contract value contraction, and concession on payment terms (deferrals, shorter billing cycles) offered in order to avoid customer attrition.
No single metric is enough
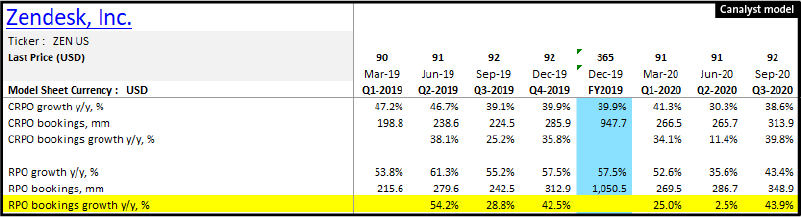
Clearly, the use of billings in isolation has limitations. We found it helpful to use the data in concert with companies’ bookings, which are also included in our dashboard. Calculated RPO bookings mitigate some shortcomings of reported/calculated billings. Those limitations include such things as timing and shorter invoicing cycles that can skew the pattern during shorter periods such as quarterly reporting. To retain customers during the demand shock, companies were breaking-up invoicing into smaller payments (from annual to semi-annual or quarterly) in order to keep most contract terms unchanged. That, in turn, reduced calculated billings, but potentially preserved the customer LTV. To what degree this was successful was often reflected in the reported RPOs that measure the backlog of both new and renewed business booked but not yet recognized as revenue. Through calendar Q1 to Q3 of 2020, HUBS and ZEN bookings showed a consistent pattern: the activity bottomed in the June quarter and accelerated in calendar Q3’20 after a rebound in the deal pipeline conversion and renewals.
Long(er) term performance
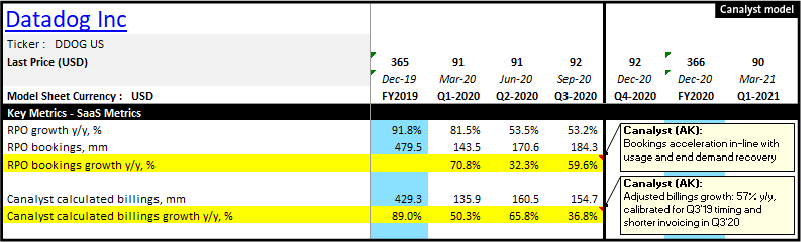
We also track billings and related growth on a longer-term basis. Datadog Inc. (NASDAQ: DDOG) reports billings and makes attempts to reconcile the change in the delta between revenue and billings growth. Investors consider those data points valuable, as DDOG’s revenue generation largely resembles that of the traditional SaaS model. Thus, for DDOG and similar names, billings and revenue growth over a longer term should track more closely. At the time of heightened volatility in H1’20, DDOG management provided additional disclosures. It reported adjusted billings figures in order to present more granularity and explain the quarterly variability. That in turn helped investors gain a better understanding of the potential impact the bookings volatility and measures taken to mitigate attrition had on performance.
Similarly, a multi-year billings trend helps us track the longer-term performance at HUBS. Its success in diversifying beyond the Marketing Hub into Service and Sales is partially reflected in the delta of revenue vs. billings growth. HUBS invoices Marketing contracts annually in advance, whereas the areas of expansion are billed quarterly and do not convert to revenue from the balance sheet. Thus, billings growth slowdown will in part be attributed to the change in the business mix. Investors will find multi-year billings and RPO trends in our dashboard for HUBS and other SaaS names.
All in, billings are an important metric that we closely follow, but in isolation they fall short of completing the performance mosaic. The Canalyst SaaS Dashboard tracks not only billings, but also RPO, bookings, and related growth to capture a more complete picture of underlying performance.
Impact on Cash Generation
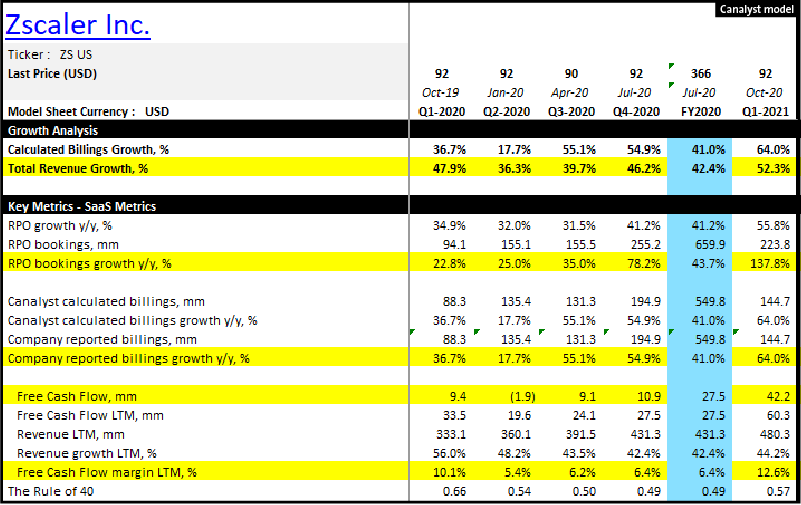
Another reason to track billings is the direct impact on cash generation. At the time of heightened liquidity risk, as in H1’20, the ability to invoice and collect payment is critical. This is especially important for SaaS companies that require high levels of investments to maintain their growth trajectory and, in turn, valuation multiples. Many were successful in achieving cash generation and multiple expansion, defying the expectations of the opposite in a macro downturn (Zscaler Inc. [NASDAQ: ZS]; DDOG).
Others were more challenged. HUBS saw FCF outflow in Q2’20, while ZEN used cash from working capital for the entire calendar H1’20 as a result of a sharp billings deceleration. We included FCF margin (LTM basis) in the Dashboard as a necessary component of a comparable SaaS analysis.
Valuation multiples
There is a valid reason for assessing the impact on cash flow more accurately for SaaS companies. Investors seem willing to pay higher multiples for those names that offer both growth outperformance and cash generation. Typically, during the high-growth stage of their life cycle, most companies require outsized investment intensity, which causes cash outflows. The SaaS space is unique in that respect as some software vendors can grow rapidly and generate cash at the same time. Among other benefits, it reduces the risk of future equity raise.
The stand-out valuation multiples in this space somewhat reflect this hard-to-replicate advantage. In order to identify such outperformers, we added to the Dashboard a metric that tracks both growth and cash generation – called the Rule of 40.
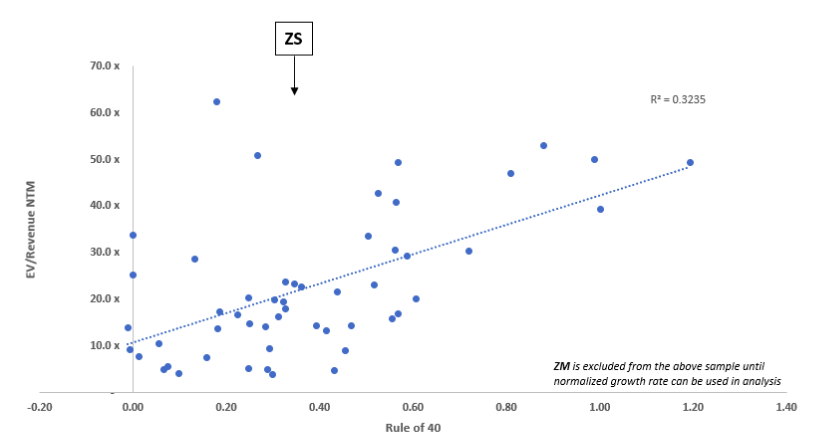
ZS stands out on multiple measures. It sits near the very top of the R40 rankings. That may be the reason it trades at one of the highest multiples in the group (see above). The Dashboard shows that ZS is one of the fastest growing and most cash-generative names in this space. During the crisis it executed flawlessly. From the start of the calendar year 2020, revenue, billings, and FCF margin had an expansionary trend at ZS. This was also backed by the bookings acceleration in the period that helped us analyze the name on a like-for-like basis.
It certainly helps that ZS has a pure-play cloud business model. It makes its performance easier to track. Other names in this space do not have that advantage. Their product or go-to market profile may not tightly resemble the traditional SaaS model of annually invoiced subscriptions. As a result, it takes modeling and further adjustment of GAAP figures in order to extract comparable data.
Normalized performance needed
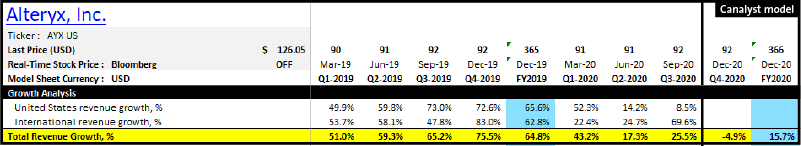
One such name is the analytics and data management vendor Alteryx Inc. (NYSE: AYX). AYX was especially challenging to analyze during the time of heightened volatility. The high concentration of term license contracts in the bookings mix makes this company’s quarterly revenue trend highly volatile. Unlike many SaaS companies where most of the recognized revenue is reported in the prior quarter’s balance sheet (ratable), AYX recognizes 35-40% of quarterly revenues from bookings in the same quarter. As a result, AYX’s top line gyrated from 43% y/y growth in Q1’20 and 26% y/y in Q3’20 to the guided -5% y/y drop in Q4’20e. As volatile as 2020 was, we are hard-pressed to find many mid-large capitalization SaaS names with a top line contraction. Those types of q/q revenue growth twists are highly unusual in this sector. One of the reasons investors award high multiples to SaaS companies is the high degree of revenue visibility allowed by the ratable recognition.
As a result, AYX management relented and changed its revenue disclosure policy. Before Q1’20, AYX had reported ARR only once before in Q2’18. Since early 2020 management reports this metric on a quarterly basis, fearing a potential multiple contraction.
Clearly, ARR growth reflects a more comparable performance. Other names with the similar revenue recognition complexity, albeit with lower concentration of term licenses, like MongoDB Inc. (NASDAQ: MDB), did not report ARR and remained opaque. In turn, Canalyst derived ARR across our models in order to allow for a comparable historical time-series performance, as well as more accurate relative comparison across the peer group. That, in turn, led us to add a set of standard SaaS industry metrics. With reported and calculated ARR, investors can now measure the return on investment on customer acquisition costs reflected in CAC, payback period, and the magic number.
Why Dashboard and why now?
What separates Canalyst’s Dashboard from other financial data products is the backing of our vast database of detailed models. We optimized and customized each model for the specific company’s underlying drivers and fundamentals. As a result, each metric presented in the Dashboard reflects a detailed analysis of financial statements, reported metrics, and management communication.
Evidently, the SaaS space has vastly matured over the last half-decade. Vendors adopted a wider set of product offerings and distribution methods across an expanding customer base that spans SMEs and Large Enterprises. The growing adoption of software as a go-to productivity tool in multiple industry verticals led to the adoption of more diverse product pricing and contract types: fixed hosted subscription, term-based subscription, usage-based pricing, computing credits, maintenance part of perpetual licenses, etc. Each of these contract obligations requires carefully modeled mechanics that correspond to the revenue recognition policy governed by emerging accounting rules, including those specifically tailored for this still developing yet quickly maturing sector.
As these names continue to gain in portfolio allocations, Canalyst will remain ahead of the curve in helping investors ramp up on their expertise using our custom models and SaaS Dashboard.