COVID-19 EBITDA & Solvency Screens, Pair Trades, Drop-in Templates, and Frank
Custom Screens
Eliminating friction between your thesis and investment opportunities
Leverage and Valuation Screen – Adjusted EBITDA across thousands of names
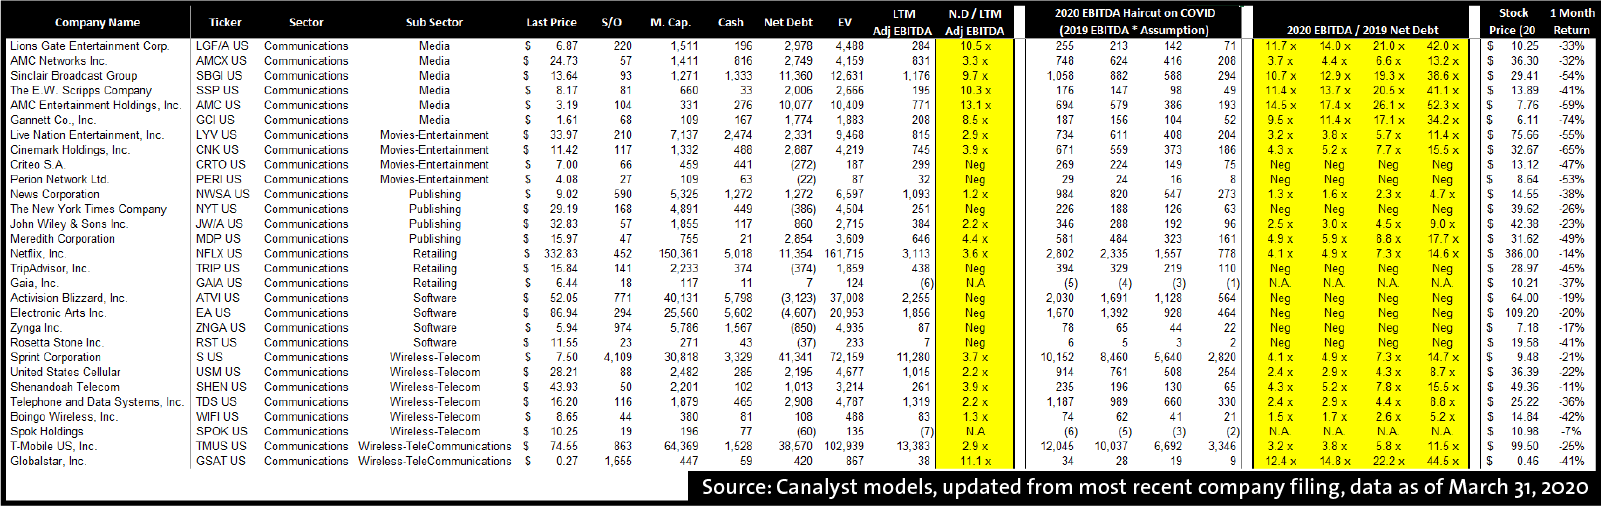
Data quality is paramount when beginning any fundamental data analysis, and at Canalyst we’re leveraging our clean data sets to help our clients screen thousands of companies faster than ever. During volatility, active managers need to quickly identify dislocations between stock price and business risk/impairment (i.e. which stocks are down 50% but are still worth 85c on the dollar). It is clear this pandemic has impacted fundamentals across all sectors, and Canalyst’s extensive coverage and data puts us in a unique position to help our clients generate investment ideas.
We started with our Leverage and Valuation Screen with EBITDA COVID haircuts – a flexible screen across 2,500 models to triangulate leverage, business impact, and valuation changes from the extraordinary events of the last month. Using this screen, you can test assumptions across a wide range of companies, as valuations morph in this volatile environment. There’s still a universe out there, and because of these changing market caps, new companies are appearing on the radar.
Solvency Screen – Who has enough cash to survive (the longest) without revenue?
Every analyst will tell you revenue is the most important line item in a model to get right. Most costs are proportional to revenue (cost of goods sold, marketing spend, staffing costs, etc.) and executive teams rationalize cost structures based on their revenue expectations. When companies miss revenue forecasts, costs are cut, re-investment into the business slows, and the future can look grim quickly.
To help our clients navigate this environment and leverage our data, we’ve built a Solvency Screen across ~3,000 names. Relieving analysts from forecasting revenue, this screen assumes that companies have zero revenue for 2020 and operating costs are cut 50% (both are adjustable for your individual outlook), to get to Days of Solvency = (OPEX Spend per day / Cash on hand).
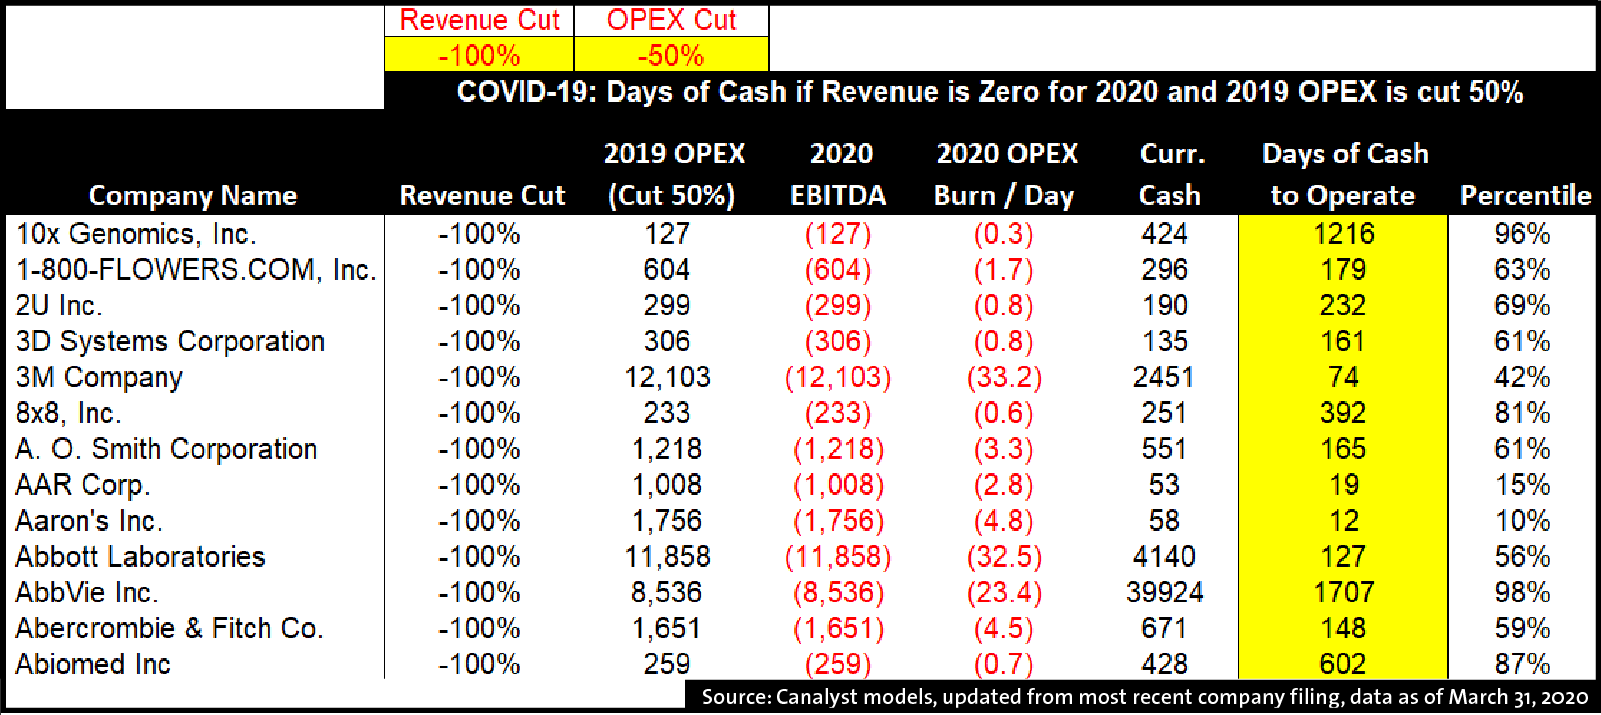
Above: Solvency Output Highlights Days of Cash to Operate for ~3,000 companies
There are many ways to use this screening tool, which is why we are excited to share it with many of our clients who will have differing views about 2020. Two ways the template may be useful are:
1) Defense: To isolate companies that have weak cash positions, sort data by “Days of Cash to Operate”; stay in front of companies that are most at risk to raise additional capital and;
2) Offense: Assess which names will outperform as the economic recovery gets underway. The market recovery is generally led by companies who have inherently weak fundamentals, are overly levered, and were priced for disaster. As uncertainty abates, these are the companies that will benefit the most from a market recovery. Use the FIFO (First in First Out) principle: Generally, the first companies to trade down at the beginning of a market correction are the first ones to lead the recovery.
By enabling our clients to transition from being defensive early in the recession (cash sufficient, quality companies) to offensive upon a recovery (cash poor, levered), the Solvency Screen is another example of how Canalyst’s data can be leveraged to uncover investment opportunities quickly.
Clients, start running scenarios today by accessing all our custom screens directly from the portal.
Everyone else, click here to request access and begin your analysis today.
Pair Trade and Waste Management
Achieve positive returns regardless of market direction
Long/short market neutral strategies have been difficult to manage in a low volatility perpetual bull market, as group performance has lagged long only funds. That is, until March, when the rapid global spread of COVID-19 started playing havoc with the stock market. While the massive spikes in volatility are reminiscent of the last major meltdown, the subsequent relief rally is unprecedented, and seemingly largely propelled by massive government stimulus and any indications that the US and European nations are managing to flatten the COVID-19 curve.
While it’s tempting to hunt for treasure, it’s difficult to time well. The market is twitchy. Monetary stimulus has overshadowed economic activity (or lack thereof), and visibility into the duration and impact of a global pandemic of this scale is limited. In this environment, short protection becomes extremely attractive. Pair trades, however, when executed properly, can achieve positive returns regardless of market direction. The trade requires two companies to be highly correlated with exposure to similar market dynamics.
Fundamentals are critical
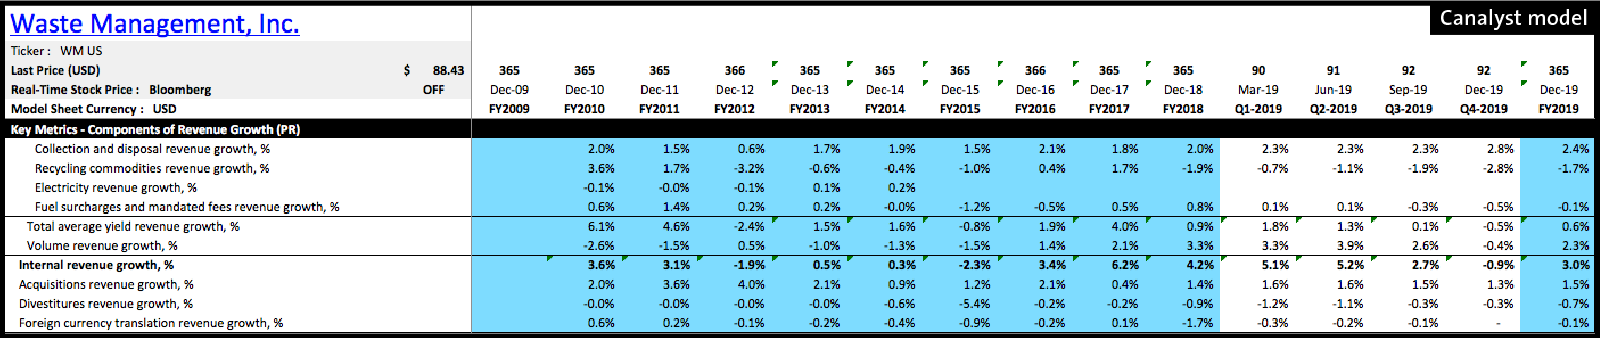
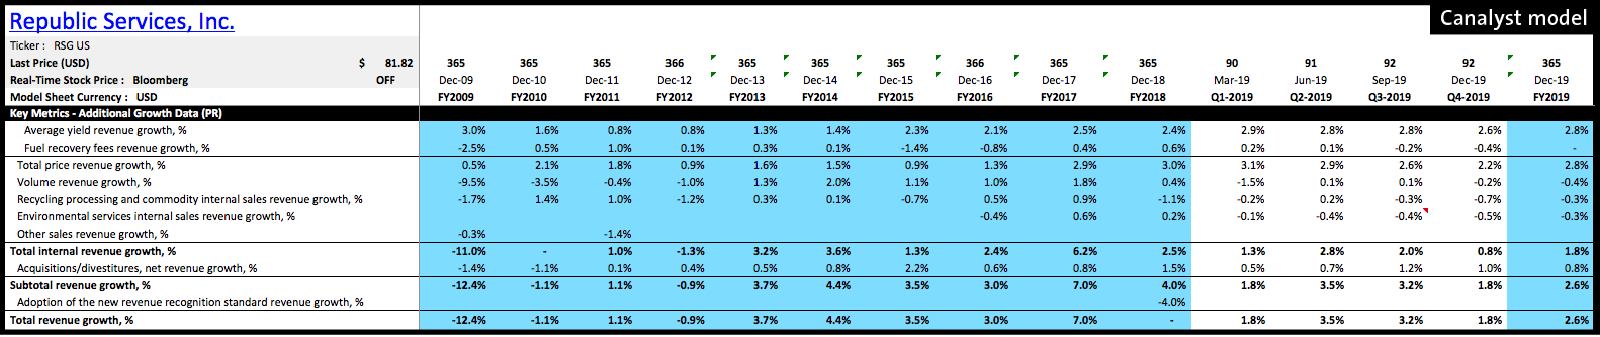
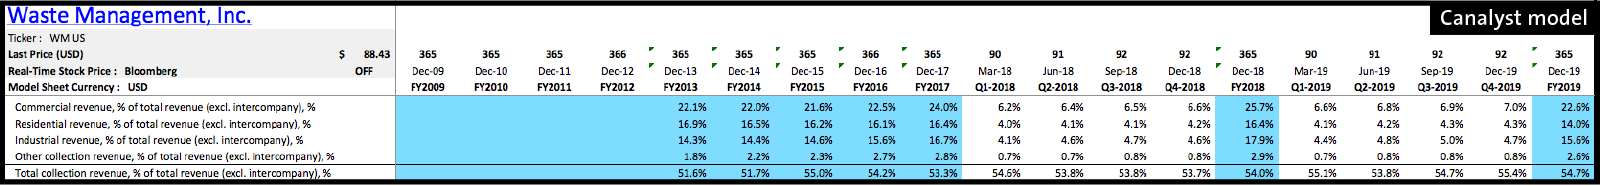
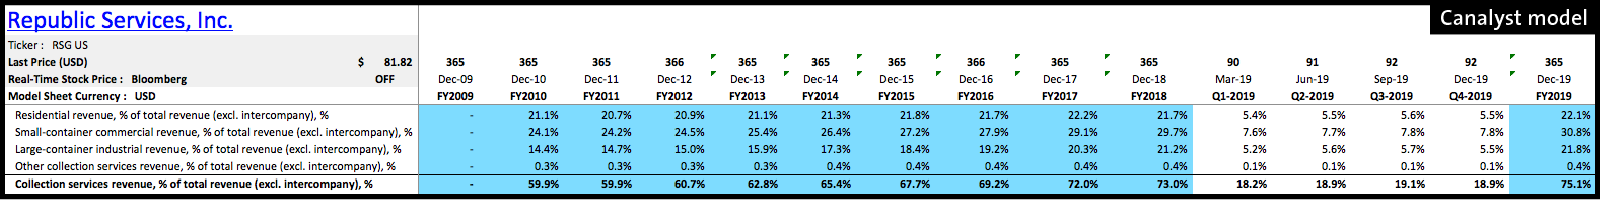
Waste Management is an interesting potential pair trade. The three large cap waste management companies — Waste Management (NYSE: WM), Republic Services (NYSE: RSG), and Waste Connections (NYSE: WCN) — are inherently defensive as they provide an essential service. Revenue is typically secured by long-term contracts, however, both volume and price growth are tied to overall economic strength.
Several data points factor into which side to take, including the percentage mix of high margin landfill revenue, exposure to industrial/commercial volumes, and the expected growth attribution between volume and yield (given volumes are likely at a considerably higher risk if the economy doesn’t rebound quickly in the short/medium term — beyond current government imposed measures — as a weaker economy is a drag on consumer spending and overall growth). Longer-term sensitivity to expected price escalation, particularly for contracts, is linked to inflation. Commodity price exposure can also be important, as it relates to recycling operations and exposure to the E&P segment. The percentage of growth historically fueled by M&A is also worth analyzing, but can management capitalize on potential opportunities that arise alongside a downturn? Has recent M&A activity stretched the cash position? Are fundamentals at greater risk as the company digests a material acquisition in a rapidly changing environment?
WM and RSG have similar business models and exposure to macroeconomic factors. They also both provide very granular (and similar) breakdown of top line revenue growth within each segment, making them fairly easy to compare.
Segment exposure provides good context for volume risk exposure. While the government imposes strict regulations on commercial business, online ordering has intensified. Residential bins are overflowing with Amazon boxes!
Want to get up to speed on the fundamentals of any name extremely fast? Read more about the Canalyst platform here.
Product News: Custom Drop-in Templates
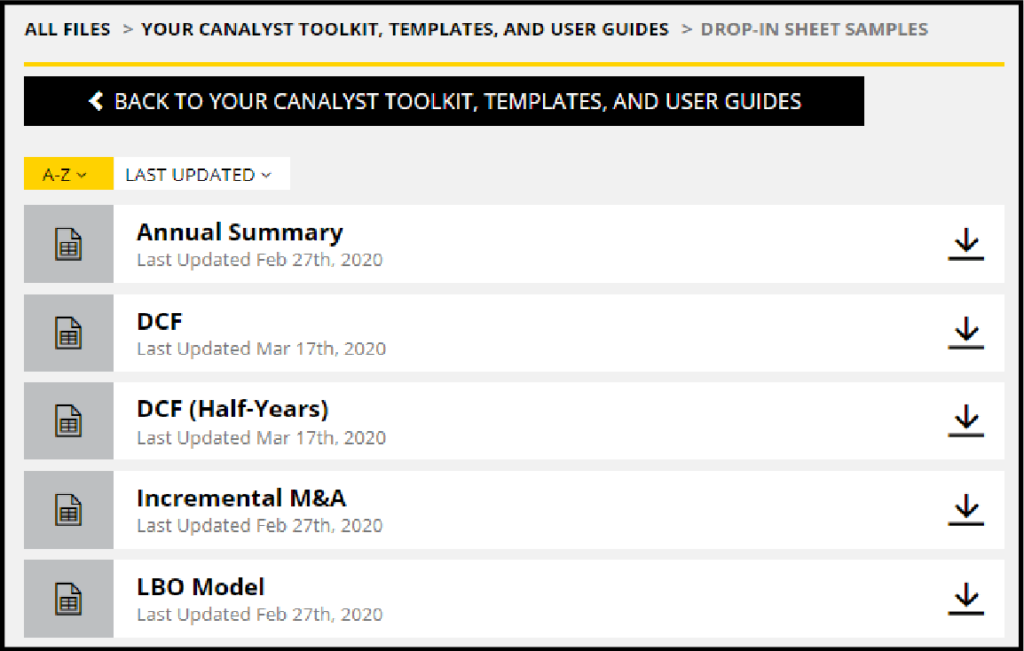
In March we released new efficiency and workflow tools to help our clients get our data the way they need it. Comp sheets, annual summary page, incremental M&A analysis, updated DCF and DCF (half-years), and LBO model templates can all be dropped into our models at the click of a button. Learn more about our custom drop-in templates here.
On the Move: New Addition to our NY Team

Frank is a bottom up fundamental analyst, and the latest addition to one of our new ‘WFH’ Manhattan offices. His strengths are attention to detail and catching secular trends early.
—
James Rife
Canalyst, Head of Equities
Prior to founding Canalyst, James had 10 years’ experience in equity research and portfolio management. He started his career in equity research with Fidelity Canada’s investment team, covering sectors including Utilities, Forestry, Technology, and Energy from 2006 to 2010. After Fidelity, he took a role as Portfolio Manager at a Boston-based $1B long/short fund, rounding out his experience across most other sectors in the process.
James holds a Bachelor of Commerce from the University of British Columbia, is a recipient of a Leslie Wong Fellowship from UBC’s Portfolio Management Foundation, and is a CFA Charterholder.