Inflation, Copper & Gold valuations, NAV tab, Business Breakdowns, and a FinTwit Stock Pitch Challenge
NAVigate the Inflation Trade
To counter the effect of pandemic induced restrictions, the U.S. Federal Reserve cut interest rates to zero and implemented the largest quantitative easing program in history, while the White House introduced an enormous economic stimulus bill, partially funded by the Fed’s purchasing of U.S. treasury bills. Corporate organizations, incentivized by low interest rates and financial uncertainty, tapped the debt markets to reinforce their balance sheets. During the 6-month period between January 1st, 2020 and June 30th, 2020, total corporate debt increased by 9.2%, while the Fed’s total assets increased by 67.9%, by far the largest 6-month increases of both metrics during the past 5 years. Currently, the Fed balance sheet and corporate debt levels are both at record levels and are continuing to rise.
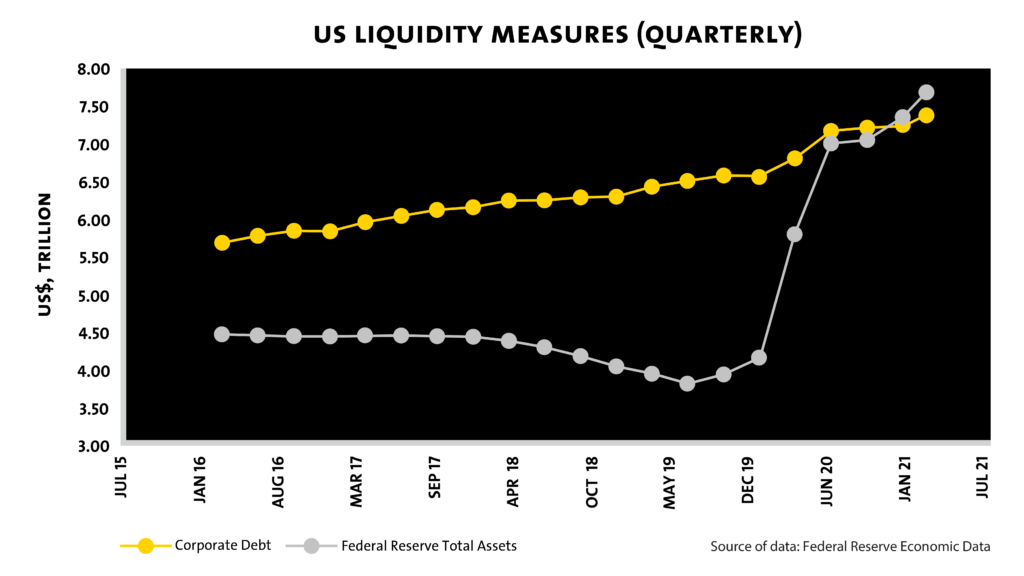
All the liquidity currently flowing through the monetary system is bound to have secondary effects on different sets of assets classes. Specifically, we can use macroeconomic indicators and trends over the past 15 months to analyze the impact of excess liquidity and inflation on the price action of two important global commodities: gold and copper.
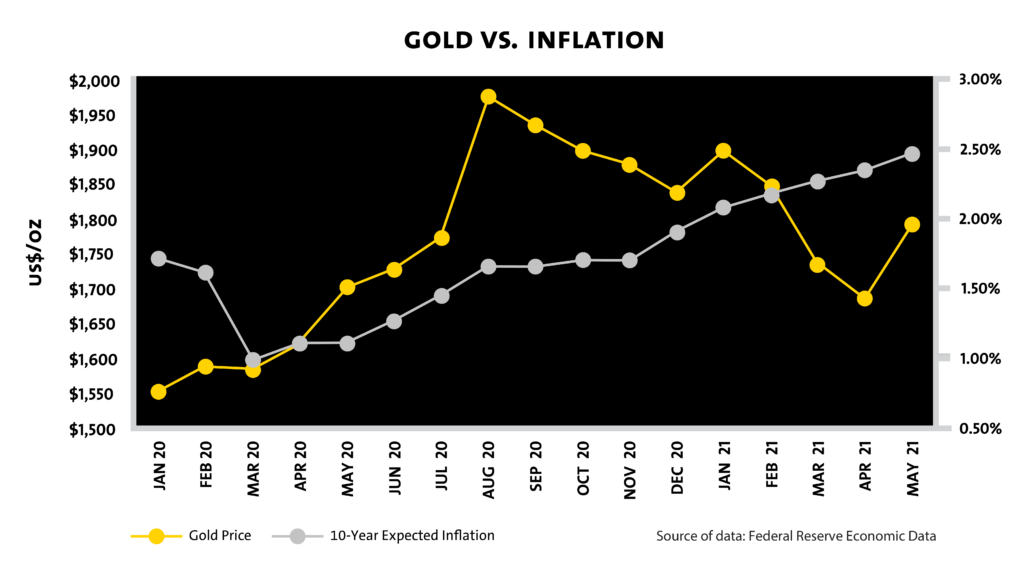
Due to its fixed global reserve and relatively stable rate of supply, gold is often referred to as an inflation hedge asset. Inflation expectations, however, tell an incomplete story about fluctuations in the price of gold. An analysis in the monthly price of gold against the monthly 10-year expected inflation rate* yields a correlation of 0.3397, suggesting a relationship that is directionally correct but isn’t strong enough to justify inflation as the primary driver.
*The 10-Year expected inflation rate is derived from 10-Year Treasury Constant Maturity Securities and 10-Year Treasury Inflation-Indexed Constant Maturity Securities. The latest value implies what market participants expect inflation to be in the next 10 years, on average.
When expected inflation rates are adjusted to include the 10-year U.S. treasury yield, the correlation becomes much stronger. An analysis of the monthly gold price against the monthly real interest rate yields a correlation of -0.9288, indicating that the degree of gold outperformance increases as the spread between inflation and the risk-free interest rate rises.
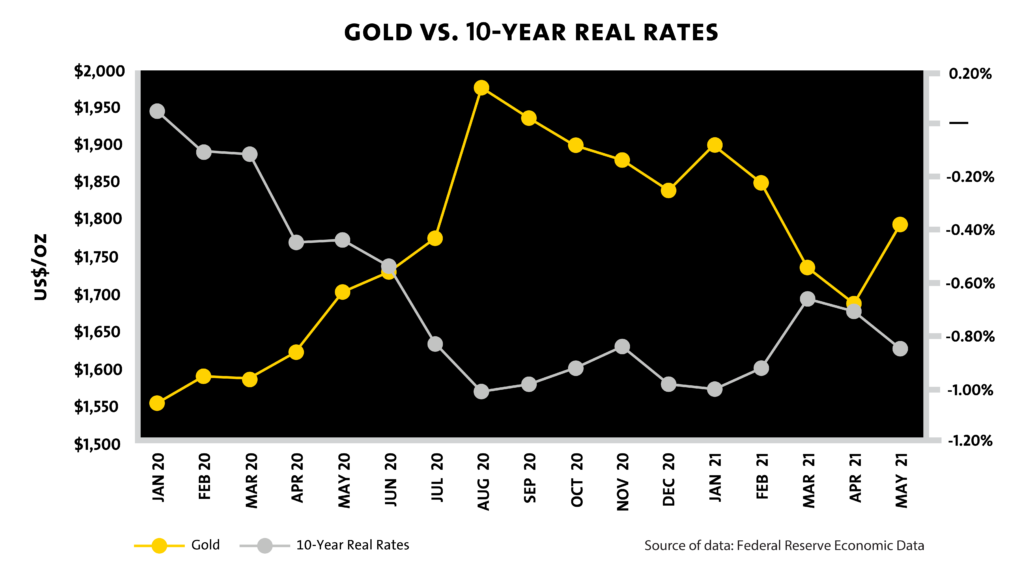
As a result, an investor acquiring exposure to gold for protection against inflation would see their investment thesis break down should treasury yields rise at a faster rate than inflation expectations. A historical example of this phenomenon occurred during the second half of 2016. During this period, the expected 10-year inflation rate bottomed out at 1.40% on June 28th, increasing to 1.95% by the end of the year. Concurrently, the yield on the 10-year treasury increased from 1.50% to 2.45%, outpacing the growth of expected inflation and lowering investor’s opportunity cost of investing at the risk-free interest rate. Accordingly, the price of gold decoupled from inflation expectations, declining from a 2016 high of $1,366/oz on July 8th to a 2016 low of $1,128/oz on December 22nd.
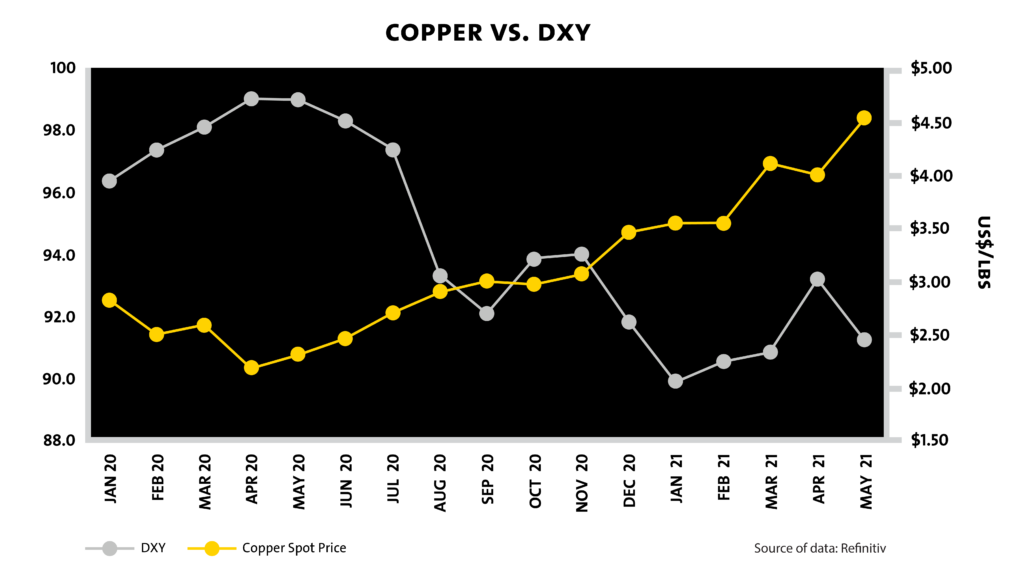
Unlike gold, copper is not generally viewed as a long-term financial asset, but rather as a consumable material in industrial goods and infrastructure. Given a relatively stable rate of global copper supply (it generally takes years for new mines to come online), the price action on copper can be viewed as a real-time indicator of global copper demand, driven by changes in consumer spending, capital investment and overall economic activity. Shown below are the monthly trends of the monthly price of copper and the purchaser’s manufacturing index (PMI), dating back to January 2020.
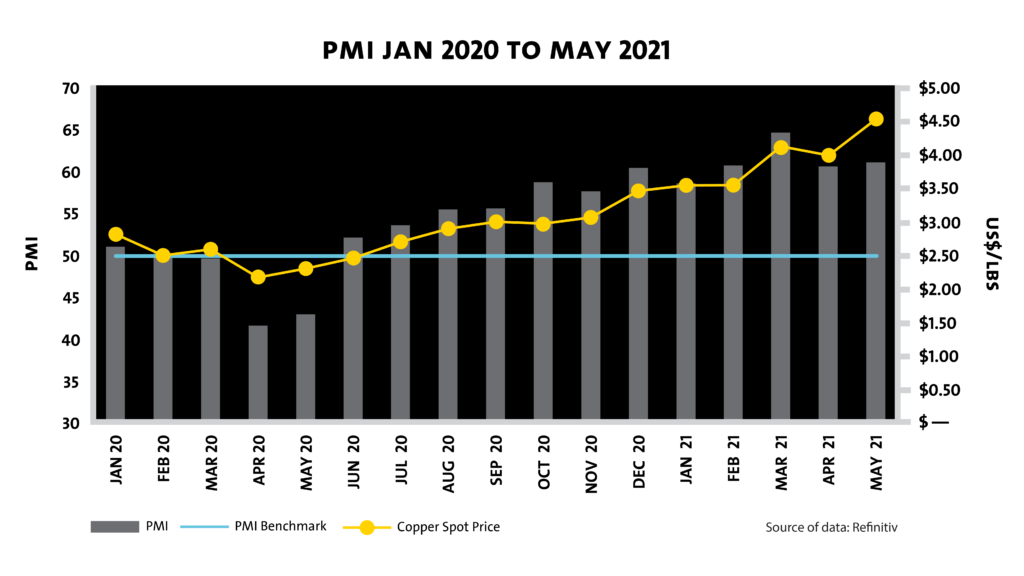
The overall level of liquidity in the financial system, combined with the lifting of pandemic restrictions throughout North America, served as an incredible catalyst for the economy, sparking rampant month-over-month growth in economic activity from the bottom in May 2020. As a result, an increase in demand for copper followed, as the beginning of the red metal’s recent bull run coincides nearly perfectly with the start of consistent monthly economic expansion.
In addition, between June 2020 and April 2021, the Fed’s focus on an elevated unemployment rate over inflation fears and other bullish indicators led to dovish monetary policy, further weakening the US dollar and placing upward inflationary pressure on both physical and financial assets. On a monthly basis from the beginning of 2020, the U.S. dollar index (DXY) and the price of copper has displayed a strong anti-correlation of -0.842.
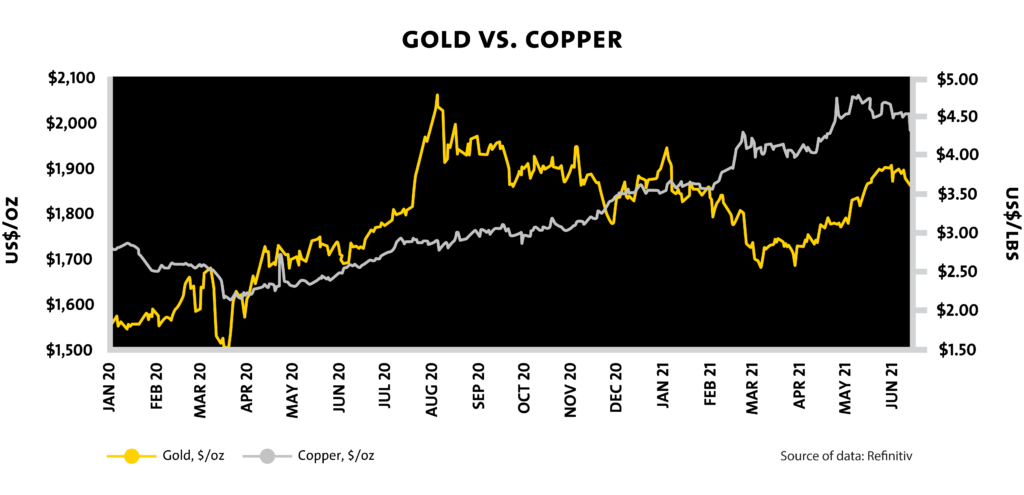
After gold prices peaked in August of 2020, the economy continued to expand as investors started to price in a potential rate hike and10-year treasury yields bottomed out at 0.52%. Over the following three quarters, the Fed maintained its dovish tone, letting the economy run hot, while fixed-income investors continued to price in higher rates. As a result, the yield on the 10-year treasury rose to 1.61%, causing real interest rates to rise by counteracting the effect of expected inflation and putting downward pressure on the gold market. Concurrently, with a weakening US dollar and rampant economic expansion, the price of copper continued a rise to record highs.
Generally, an overheating economy leads the governing institution to control inflationary pressures by implementing hawkish monetary policy. However, the recent degree of divergence between economic activity and hawkish monetary policy has served as rocket fuel for commodity prices. These effects have now begun to filter their way through supply chains as Procter & Gamble (NYSE: PG), Home Depot (NYSE: HD), and Coca-Cola (NYSE: KO) have all begun to implement price increases in order to combat the effect of rising material costs on profitability.
Procter & Gamble: “The Company has started the process of implementing price increases on its Baby Care, Feminine Care and Adult Incontinence product categories in the United States to offset a portion of the impact of rising commodity costs.” – Q1/21 earnings release.
Home Depot: “Inflation from core commodities positively impacted our average ticket (average price paid per transaction) by approximately 375 basis points in the quarter, primarily driven by lumber and copper.” – Q1/21 conference call transcript.
Coca-Cola: “Coca-Cola will raise prices on it’s drinks to combat the impact of higher commodity costs. There is built up pressure for materials in 2022, so there will have to be some price increases.” – Coca-Cola CEO James Quincy, CNBC interview April 19th, 2021.
We suspect that investors who identified the potential for the future copper and gold price decoupling prior to July 2020 likely ran a screen similar to the one below to capitalize on this trend. We’ve compiled a sample of Canadian-listed mining companies, including each company’s revenue exposure to gold and copper over the last twelve months, as well as the sensitivity of each company’s share price relative to changes in the prices of gold and copper, represented as beta. Also included is each stock’s standard deviation of daily returns to indicate a general level of investment risk.
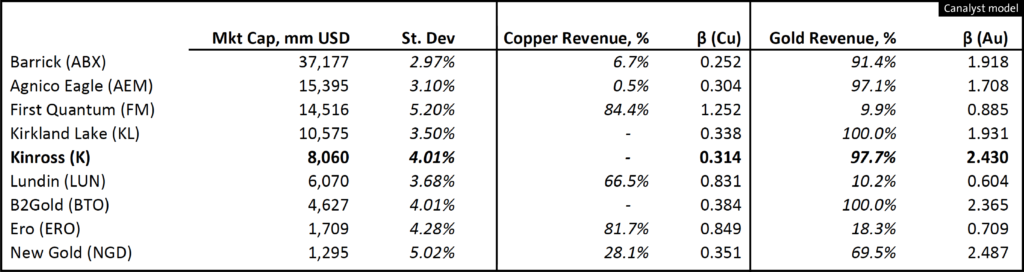
With approximately 2.4x leverage to the price of gold, Kinross (TSE: K) could serve as a potential source of outperformance for those with high conviction in the long-term impairment of real interest rates. As a mature, large-cap gold miner, Kinross has managed to keep its production costs stable over the previous five years, allowing incremental increases in the price of gold to be captured directly in its gross margin (mining margin increase from $463/oz in FY2015 to $1,051/oz in FY2020).
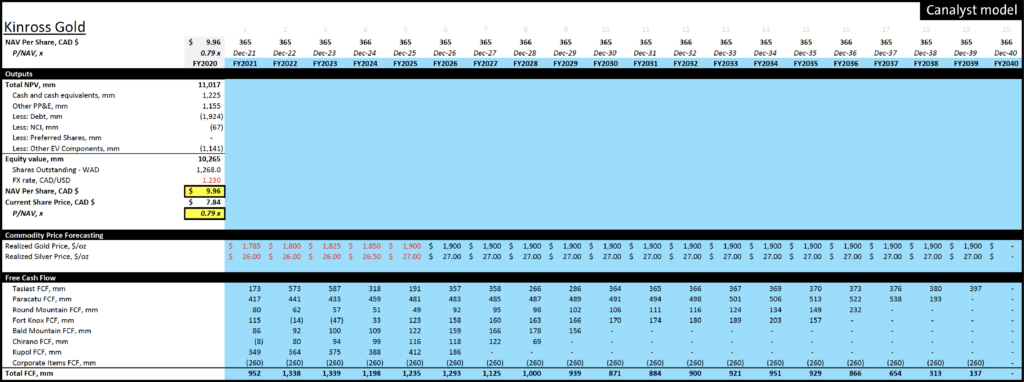
With data sourced directly from the most recent operating updates and technical reports, we did some analysis using our newly implemented net asset value (NAV) tab. The NAV provides a detailed capex schedule, operating cost breakdown and a comprehensive life-of-mine production plan for each individual mine. Using gold and silver price forecasts estimated by the 5-year gold forward curve and a discount rate of 5%, Kinross’ Fort Knox mine in Alaska provides approximately US$1.21 billion of value to the firm.
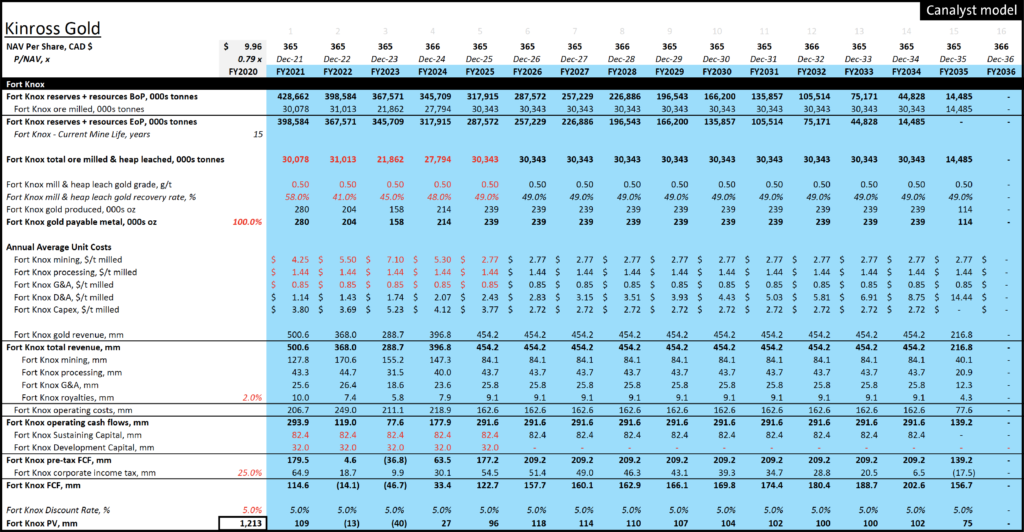
Replicating this analysis for all of Kinross’ mines allows for a complete bottom-up valuation analysis based entirely on detailed geological, property and operating data. Based on this info, the output from our NAV tab suggests Kinross’ NAV is CAD $9.96/share, representing a P/NAV multiple of 0.79x over its current share price (market close, Friday June 25th).
The NAV tab can also be used to triangulate valuation in a dynamic and volatile commodity price environment. Using the gold and silver 5-year forward curve forecast estimates, a sensitivity analysis was done to determine Kinross share price targets given a shift in the gold and silver forward curves and P/NAV multiple expansion or compression.
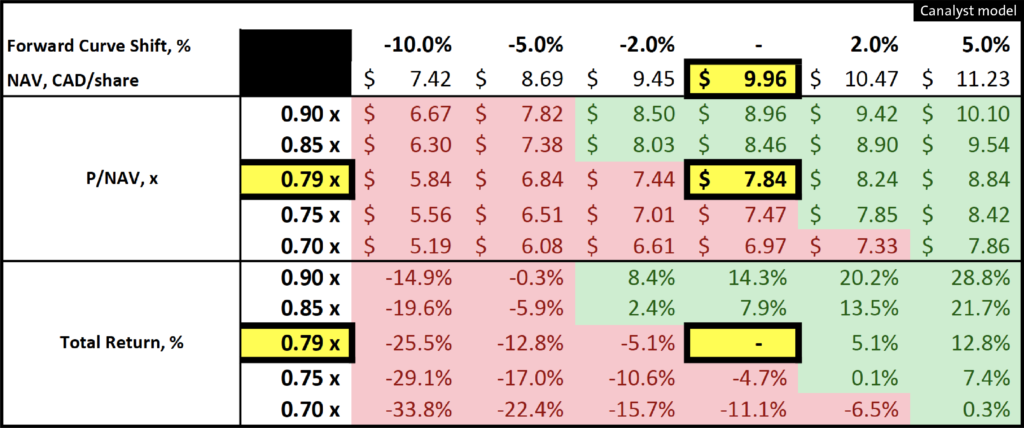
Assuming no re-rating of Kinross’ P/NAV multiple, a 2% upward shift in the gold and silver forward curves will result in a 5.1% increase in the company’s NAV (CAD $10.41/share) and share price (CAD $8.24), roughly in line with the 2.4x gold price leverage determined earlier using historical market data.
Although this sensitivity analysis considered changes in just two important valuation considerations, the NAV tab can also be used to alter discount rates and extend or shorten mine lives, as well as capture changes in projected operating costs, capital costs and production guidance. The Kinross model with the NAV tab is available for download through the Canalyst portal.
Product News: New Model Color Scheme
Last month, we launched a new color scheme designed to make it easier to identify different cell types and data.
Using colors commonly used in finance, the new color scheme makes it easier to distinguish cells that contain hardcodes from cells that contain formulas:
- BLUE — forecast drivers and historical hardcodes, starting points for modifying forecast values to express your views, and following formula paths to identify dependencies
- BLACK — formulas
- GREEN — formulas with references to other worksheets within the model, allowing you to quickly pinpoint metrics that are dependent on supplemental data
- GREY — annual columns
Download any Canalyst model in the new color scheme instantly from the portal by clicking the ‘Download a Different Format’ button, or set it as your default in your Settings page. Learn more here. Not yet a Canalyst client? Request a demo today.
Canalyst in the Wild
Fintwit Stockpitch Competition
Canalyst is a proud sponsor of the first ever FinTwit Stock Pitch Challenge! The winners are competing for $15k in cash, a Canalyst subscription, and services from the other gold sponsor, Tegus. Plus, contest judge Bill Brewster has offered to host the winner as a featured guest on his podcast, The Business Brew!
Submissions closed yesterday, and finalists will be selected to pitch their ideas live on Twitter Spaces at 4pm ET on July 15th for famous FinTwit judges @akramsrazor, @BillBrewsterSKG, @compound248, @ElliotTurn, and @SuperMugatu. Be sure to follow @stock_pitch for contest updates.
Business Breakdowns
For the month of June, Canalyst partnered with the Colossus’ newest podcast, Business Breakdowns. Listeners of Patrick O’Shaughnessy’s Invest Like the Best will be familiar with the platform and its high-quality and detailed podcasts and content related to business building and investing.
Business Breakdowns dives into the details of individual companies with investors and operators that know it best. To help you with each company Business Breakdowns explores, Canalyst provided accompanying models for all episodes in the month of June.
Visit here to find downloads of $ALGN, $PDD, $MRNA, $FWONK,
and $FB.
James Rife
Canalyst, Head of Equities
Prior to founding Canalyst, James had 10 years’ experience in equity research and portfolio management. He started his career in equity research
with Fidelity Canada’s investment team, covering sectors including Utilities, Forestry, Technology, and Energy from 2006 to 2010. After Fidelity, he
took a role as Portfolio Manager at a Boston-based $1B long/short fund, rounding out his experience across most other sectors in the process.
James holds a Bachelor of Commerce from the University of British Columbia, is a recipient of a Leslie Wong Fellowship from UBC’s Portfolio Management Foundation, and is a CFA Charterholder.