SPACs, WE, Diagnostics, Coinbase, and Invest Like the Best
SPACs A’maze
We’ve been building a lot of SPACs lately. The growing acceptance of SPACs as a financing vehicle and the resulting deal volumes warrant a closer look. In 2020 and the first few months of 2021, 540 SPACs have listed, raising gross proceeds of $177.9 billion. Contrast this with the 10 years prior to 2019 where 226 SPACs listed, raising gross proceeds of $47.1 billion.
Democratizing the IPO “Pop”
We examined some key factors that differentiate SPACs in their ability to generate sustainable returns. Undoubtedly, investors recognized the value of participating in SPAC offerings; the perceived benefits drove the ramping inflection in deal volumes through 2019-2020. We note multiple favorable factors, such as:
- Low transactional cost for the Company, as the process avoids the traditional IPO underpricing engineered by the underwriters
- Accelerated time to public markets for growth companies; an increasing number in recent years chose to stay private for longer
- The SPAC shareholders’ voting power that improves the general governance
- The optionality to redeem the original investment in full, making SPAC a no-risk proposition when terms are unfavorable
In our view, the opportunity to be an early investor in a growth company stands as the most attractive reason to deploy capital in a SPAC structure. Specifically, the vehicle allows the public to be on the winning side of the proverbial IPO pop. This typically positive price action (averaged ~20% over the last 2 decades) on the first day of trading for popular IPOs is often inaccessible to the general public. Instead, the proceeds are allocated to large institutional investors at the expense of the company’s existing shareholders, as often the pop results from an intentional underpricing of the offering.
Cost-Benefit Analysis
SPACs aspire not only to democratize early stage returns, but also to benefit the target’s shareholders by applying a fair market value from the outset. Further to this point, direct listings have also become a popular way to avoid the IPO underpricing.
The costs of the perceived benefits of SPACs need to be understood. Early on in the period of the SPAC frenzy, the impact of the sponsor’s “promote” became the focal point of the discussion. To illustrate, we offer a typical example:
Usually sponsors pay a nominal sum to cover initial start up costs, often $25k, to take a 20% stake in the SPAC. At a common subscription price of $10/share, the pre-merger redemptions, which can be as high as 50% of total shares issued, could lead to ~$6.67/share, a material dilution for the SPAC shareholders.
The reason the dilutive impact can be surprisingly high is the structure behind the vehicle. The IPO subscribers have the option to redeem their shares for the full $10/unit. In the period prior to the merger, the same investors get the risk-free rate of return, as well as warrants and rights that remain valid even after a participant has redeemed its shares.
But what about the remaining shareholders who look to capture the IPO (the merger in SPAC’s case) pop? The costs could end up largely with the SPAC shareholders. In that case, target’s shareholders benefit at the expense of the (non-redeeming) participants. If that’s true and cost is overwhelmingly placed on the SPAC shareholder side, what motivation would there be to hold the shares? Why participate in a SPAC, given the unattractive historical performance?
In our view, the answer depends on the ability to apply the core principles of the fundamental equity analysis. In particular, if management negotiates as it would for the regular IPO (based on cash it would receive from the equity offering), the viability of a merger is directly related to the deal terms. They include the share exchange ratio, which in turns depends on the target’s underlying fundamental value, which, as always, is uncertain and requires the skills and training of a securities analyst.
Thus, ascertaining the fair value of a SPAC-promoted target can help parse out the winners from the losers. Said another way, the ability to derive the underlying fundamental value of a business is an unavoidable step for a SPAC, as it is for any other investment.
Another approach sponsors take to limit dilution is replacing redemptions with PIPE investments. These third-party investors not only mitigate the cost that is a high predictor of performance, but they also provide a stamp of approval for the deal. PIPE investors are typically institutional money managers who are granted a closer (“over the wall”) access to perform due diligence.
Essentially, a SPAC-related investment performance reflects the ability to more than offset the dilution faced at the outset. That, in turn, depends on the ability to ascertain the deal terms, which stems from the propensity to accurately value the proposed target. All of that makes a SPAC no different from any other high-risk equity investment. It involves the skills necessary to accurately derive the underlying potential of a business.
As a provider of fully-functional financial models, Canalyst helps the process of evaluating a SPAC deal. Our ability to build models while others are still on restriction, and update them within hours when news hits makes us a trusted source of unaltered data with the underlying quality that is necessary for all stakeholders (sponsors, SPAC shareholders and PIPE investors) to grasp the complexity of this risky yet highly profitable opportunity.
WE Take Another Look – IPO turned SPAC offering
Back in 2019, we spent some time reflecting on The We Company following the retraction of a very creative S-1 and an indefinite delay to its over-hyped IPO. We focused on what we know best: fundamentals, through our pre-IPO model (still available for historical reference in our first look SPAC model). The earlier model highlighted a pretty unflattering historical profitability metric – negative EBITDA margins (ranging from -50% to -70% through FY16-FY18), with the cash flow summary revealing that they have issued debt and equity to sustain their negative cash flow from operations. The numbers also revealed that its multi-digit revenue growth over the 2 year period was made possible through significant capital expenditures.
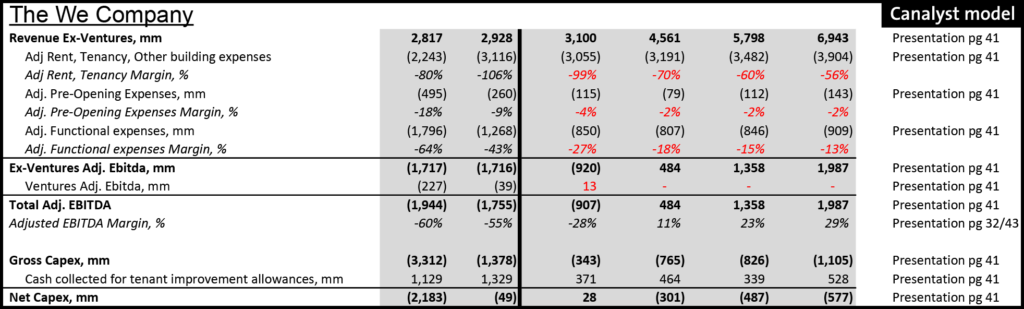
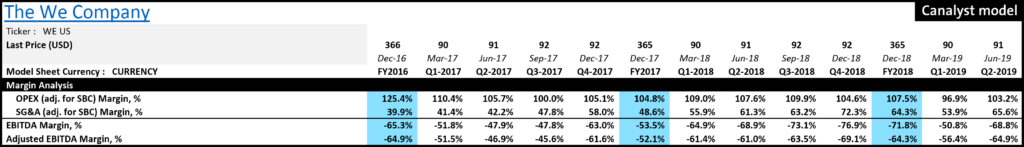 The recent historicals in our new first look model share some similarities. The adjusted EBITDA margins range from -60% to -55% in FY19 and FY20 and net capex represents 68% of total revenue in FY19. However, net capex moderated materially in FY20 at just 2% of total revenue. And management projections suggest that that percentage will remain in single digit territory through FY24E, despite material pick up in expected FY23E revenue (up 41% y/y).
It’s also hard to judge a commercial real estate business based on 2020 financials. Management is projecting a fairly rapid ramp up in physical occupancy through 2021 and has laid out a “clear path” to adjusted EBITDA breakeven in Q4/21 based on 70% physical occupancy. WE wonders if the market shares the optimistic outlook. We built a prototype First Look WeWork SPAC model:
The Re-opening Dichotomy within the Diagnostics Space
At the onset of the COVID-19 pandemic, the medical diagnostic labs invested heavily in polymerase chain reaction (PCR) and antigen testing capacity to prepare for the large increase in diagnostic testing volumes that was inevitably headed their way. At the time, the duration of the pandemic and the need for heightened testing capacity was anybody’s guess.
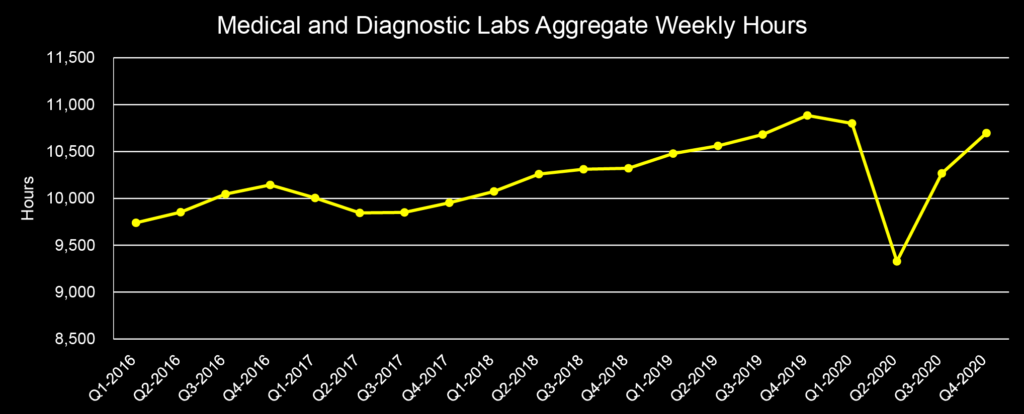
Investments in simple, often automated, testing instrumentation were a way to increase the capital-to-labour ratio and achieve a greater level of output per worker. In Q2/20, the industry’s aggregate weekly hours fell 14% from Q1/20 levels before rebounding to being down just 5% in Q3/20. The aggregate weekly hours data is shown in figure 1, below.
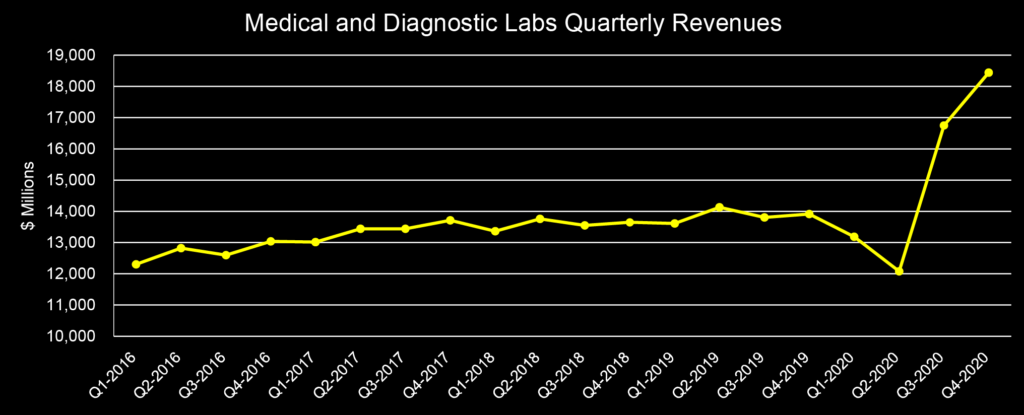
With fewer staff, equipped with more mechanical capacity, the industry achieved successive record quarterly revenues in Q3- and Q4/20, as shown in figure 2, below.
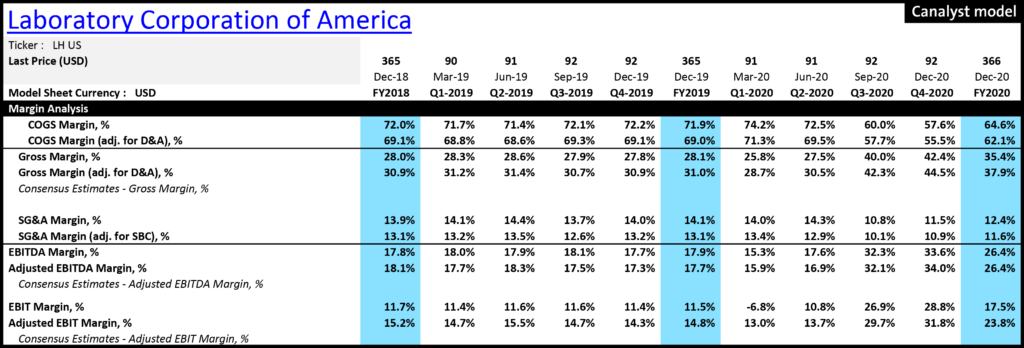
Laboratory Corporation of America (“LabCorp”, NYSE: LH) and Quest Diagnostics (NYSE: DGX), are the two largest and most diversified publicly-traded companies in the medical diagnostics industry, and generally representative examples thereof. LabCorp’s diagnostics segment quarterly revenues have a significant 96% correlation to those displayed in figure 2 over the last eight years and their operating margins nearly doubled in the H2/20 as a result of COVID testing dominating demand. LabCorp’s margin profile is shown in figure 3, below.
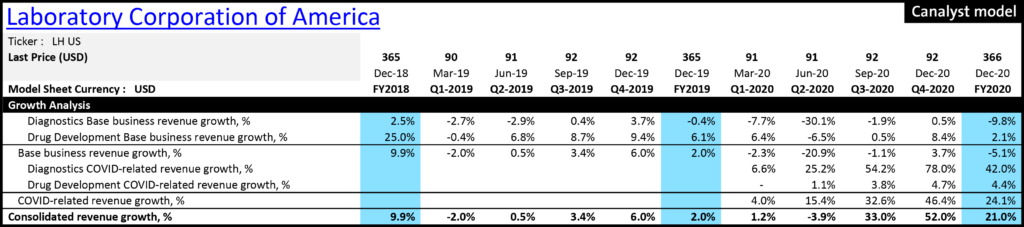
The industry was able to thrive with a reduced headcount for the period in which relatively simple COVID testing dominated demand. Now, aggregate hours data has returned to near pre-pandemic levels in Q4/20, implying an impending return of the base business. Continuing with LabCorp as an example, the relative contributions of COVID testing and the base business to the top line growth of the diagnostics segment, shown in figure 4, confirm that this is the trend.
For FY2020, LabCorp and Quest focused their efforts on COVID testing to such a degree that contractions in their base business operations were more than offset. Other less diversified diagnostic lab companies such as NeoGenomics (NASDAQ: NEO) and Exact Sciences (NASDAQ: EXAS) provided some capacity for COVID testing without it becoming a main focus.
The U.S. Census Bureau collected data throughout the year to track the number of people delaying medical care due to fear of COVID and/or inability to afford the services as a result of having lost employment. A summary of this data, broken down by age range, is displayed in figure 5.
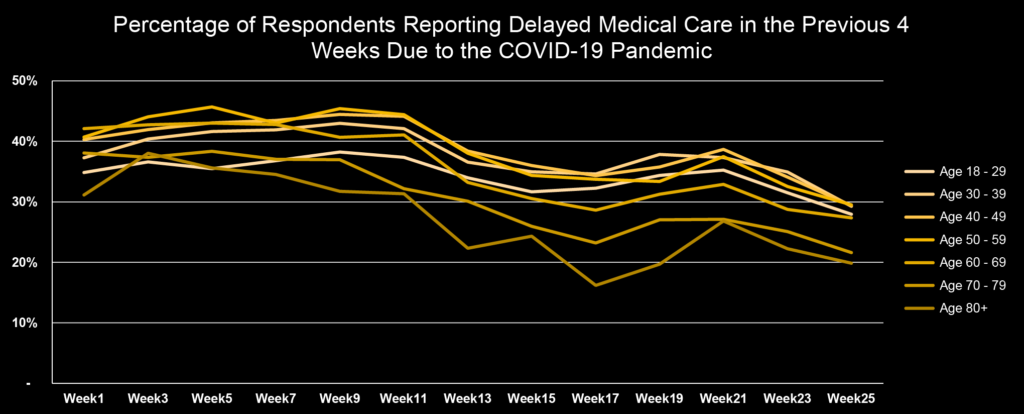
The full return of non-COVID testing activities such as cancer testing is expected to be a major tailwind for the industry in 2021 as pent-up demand comes online. Speaking at an Institutional Investors Conference at the start of March, Doug Brown, the CDO at oncology diagnostics firm NeoGenomics, noted that the company was back to providing testing services above pre-pandemic levels despite lingering trepidation in some of the more populous states. Specifically, he noted that January oncology testing volumes were up in red states to the tune of double-digit growth while volumes were still down in blue states such as California and New York, echoing the Household Pulse Survey data. As of March 1, 2021, 35% and 29% of those in California and New York aged 60 and above reported delaying medical care in the last four weeks compared to 23% in the rest of the country.
Assuming that this was approximately the case in the lead-up to year-end, Neogenomics saw 5.1% year-over-year requisition growth in Q4/20 with only a minority of their usual addressable market being back to anything resembling full operations. Given that 50% of cancer diagnoses are attributable to patients aged over 65 and that roughly 37% of the U.S. population aged 65 and above reside in California and New York, it stands to reason that the recovery of cancer testing was underway in Q4/20 but nowhere near peaking. This will also likely be evident in the Q1/21 earnings reports of NeoGenomics’ peers that are levered to oncology diagnostics and minimal residual disease testing such as Natera (NASDAQ: NTRA), Exact Sciences (NASDAQ: EXAS) and Veracyte (NASDAQ: VCYT).
Product News: Excel Add-in
Earnings just got a whole lot better. The Canalyst Updater Tool is now available directly in Excel. You no longer need to leave Excel when you want to update your customized models for the most recent data available. Breathe easy knowing that your customizations will be preserved seamlessly when you update your model.

- The same Updater functionality you love, now better integrated into your workflow — perform model updates from within Excel
- Incorporate the latest earnings updates into your customized models with the click of a button
- Run a variance report showing side-by-side comparisons, so you can easily spot the differences between your forecasts and company-reported results


To start updating your models from within Excel today, download the installer of the Canalyst Excel Add-in right from the portal. Not yet a Canalyst client? Request a demo of our 4000+ equity model database today.
Coinbase IPO
The cryptocurrency market received a huge validation boost within the last year as companies like Microstrategy (NASDAQ: MSTR) and Tesla (NASDAQ: TSLA) started adding Bitcoin to their balance sheets. It marked the beginning of a new era for the asset class in which institutions, as opposed to retail investors, are at the helm of the cryptocurrency movement. Most of these institutions have something in common: they use Coinbase services to make their big cryptocurrency purchases. In essence, Coinbase was already leading the retail trading business and is now leading the new institutional trading business as well, creating the perfect storm for their recent IPO on April 14th. Check out our Coinbase COIN US model for all the details!


Patrick x Canalyst CEO
Our 2021 partnership with podcast Invest Like the Best continues in April, with a rare public appearance by Canalyst co-founder and CEO Damir Hot. In a 4-part miniseries that follows each April podcast episode, Patrick sits down with Damir to hear about the origins of Canalyst, the problems we solve for professional investors, and what the future of Canalyst looks like.
Check out this week’s episode for Patrick’s conversation with Chris Dixon of Andreessen Horowitz on the potential of blockchain technology, and last week’s episode with Jesse Jacobs and Mike Kerns of The Chernin Group as they discuss innovation in the creator space. Be sure to listen through to the end of all the April episodes for Damir’s interviews with Patrick.
![]()
James Rife
Canalyst, Head of Equities
Prior to founding Canalyst, James had 10 years’ experience in equity research and portfolio management. He started his career in equity research with Fidelity Canada’s investment team, covering sectors including Utilities, Forestry, Technology, and Energy from 2006 to 2010. After Fidelity, he took a role as Portfolio Manager at a Boston-based $1B long/short fund, rounding out his experience across most other sectors in the process.
James holds a Bachelor of Commerce from the University of British Columbia, is a recipient of a Leslie Wong Fellowship from UBC’s Portfolio Management Foundation, and is a CFA Charterholder.