Nothing beats having access to clean fundamental data. Canalyst Dashboards leverage our clean fundamental data sets to help investors make informed investment decisions faster than ever before.
We identify the constituent companies and key metrics for a given industry. Our team of analysts then dive deep into the company reports to collect the key company reported data. They spend hours reading footnotes, reviewing investor presentations, analyzing charts to detect the hard-to-find reported key metrics so that you don’t have to.
Canalyst Dashboards package all of the key metrics, together with clean fundamental valuation, growth, margin, and liquidity metrics into one place so that you can remain focused on your analysis.

Some of our more popular dashboards include:
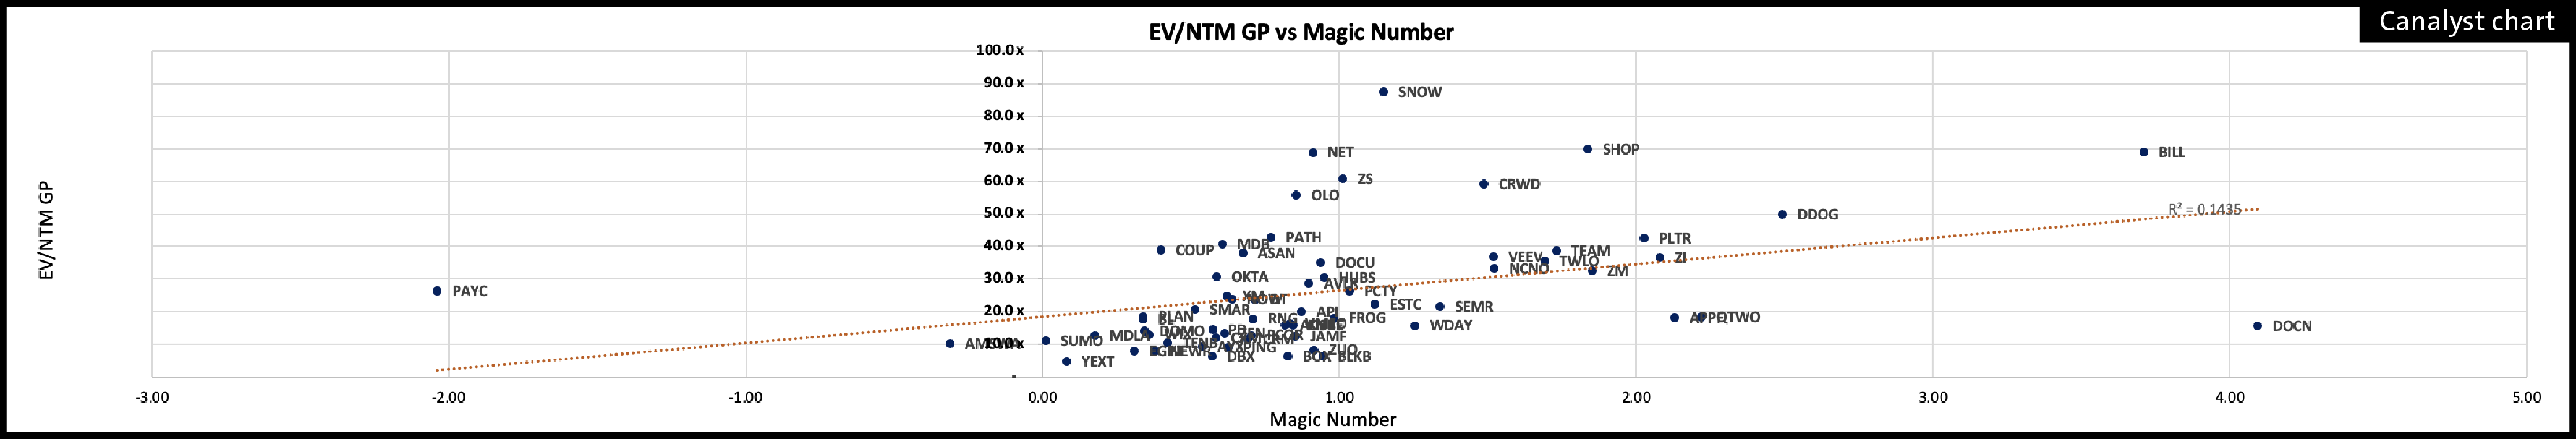
Enterprise SaaS Dashboard — Get a head start by analyzing key metrics like ARR, Remaining Performance Obligations (RPOs), Billings, Magic number, Rule of 40 and Payback Period for tickers including SNOW, ZM, CRM, DOCU, and 60+ more companies.
Internet Retail Dashboard — Stay on top of performance metrics including GMV Growth, GMV per Buyer and Seller, Order Growth, Take Rate Change, for companies like AMZN, EBAY, ABNB, and 27+ more companies.
Payments Dashboard — Understand how the number of transactions, Take Rate, Total Processing Volume (TPV), Payments Revenue, and more differ across the key players, including PYPL, ADYEN, and SQ.
Switch to the Charts Tab at the bottom of a dashboard to get a visual presentation of key data across tickers:
Dashboards enable investors to identify trends and key areas for future performance among constituent companies. Clients, increase your edge by accessing all of our Dashboards directly from the portal.
Not yet a Canalyst client? Request a demo to learn more about Canalyst Dashboards today.