The following is an example of the use of Canalyst Fundamental Data using Candas, not intended to be a recommendation of action.
Update: The second part of this analysis is up! Click here to see our analysis.
The Python Jupyter Notebooks supporting this analysis can be found at our Candas Github Repository.
JPMorgan Chase & Co. (NYSE: JPM) reports on January 14. Historically, it has been the first money center bank to report earnings. Given that it is a money center bank, JPM touches on many subsectors within financials such as:
- Card Processing (V MA GPN)
- Credit Cards (COF DFS)
- Capital Markets (GS MS)
- Securities Servicing (STT BK)
Consensus opinion holds that these stocks should trade on their corresponding line items from JPM.
In this brief report we outline some surprising conclusions looking at a few of these consensus relationships using Candas, Canalyst’s new Data Science Library.
Observations:
01 — JPM comparable line items have a .95+ R-squared with MA debit and credit volumes and V debit volumes.
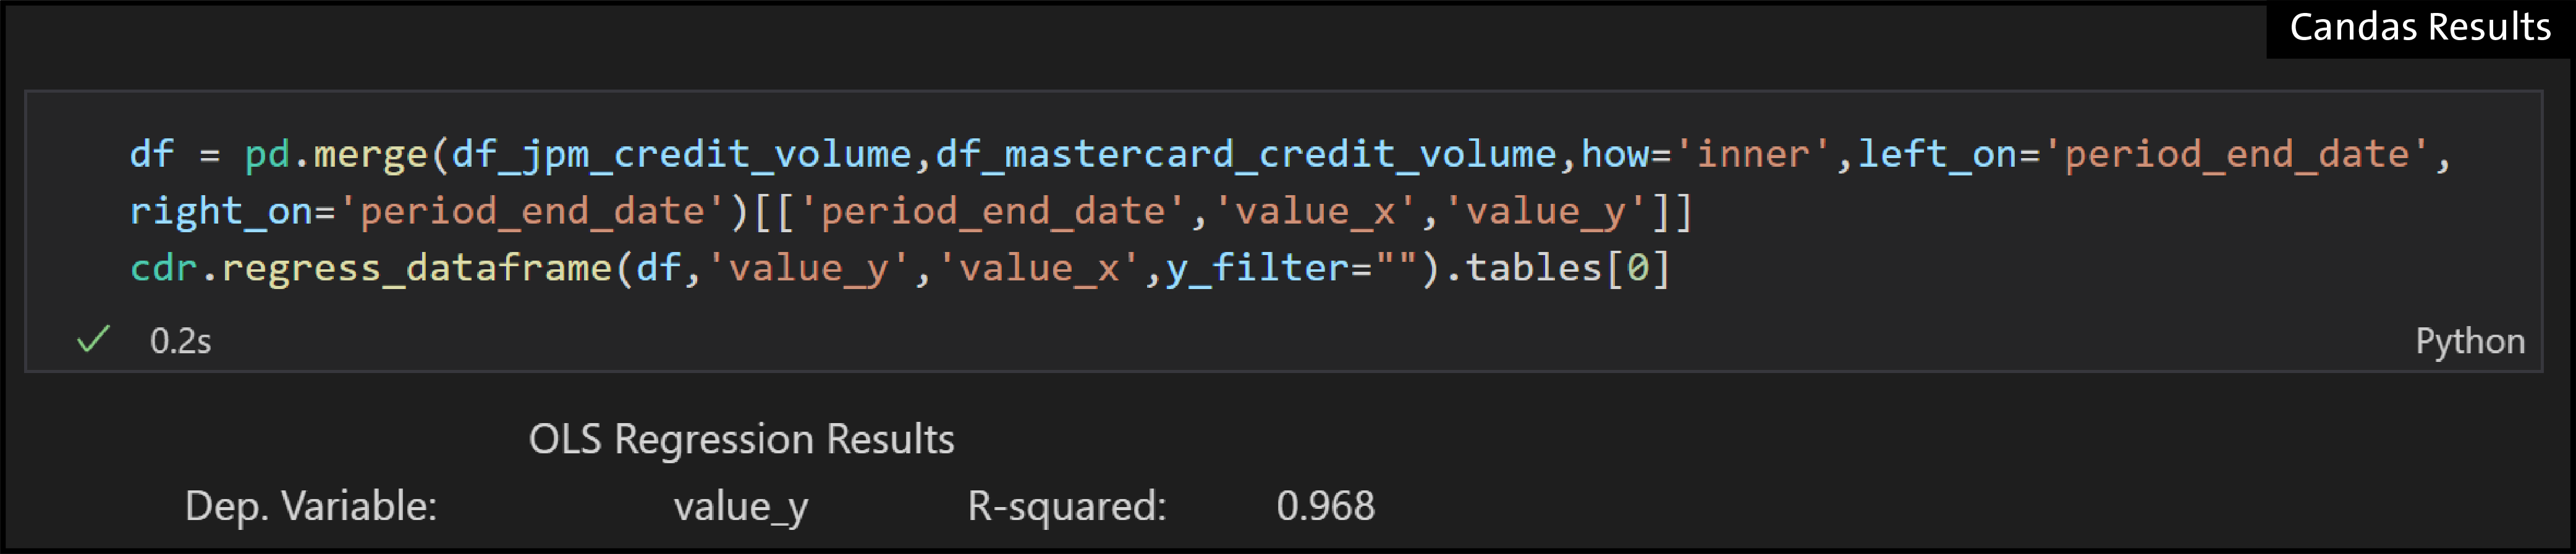
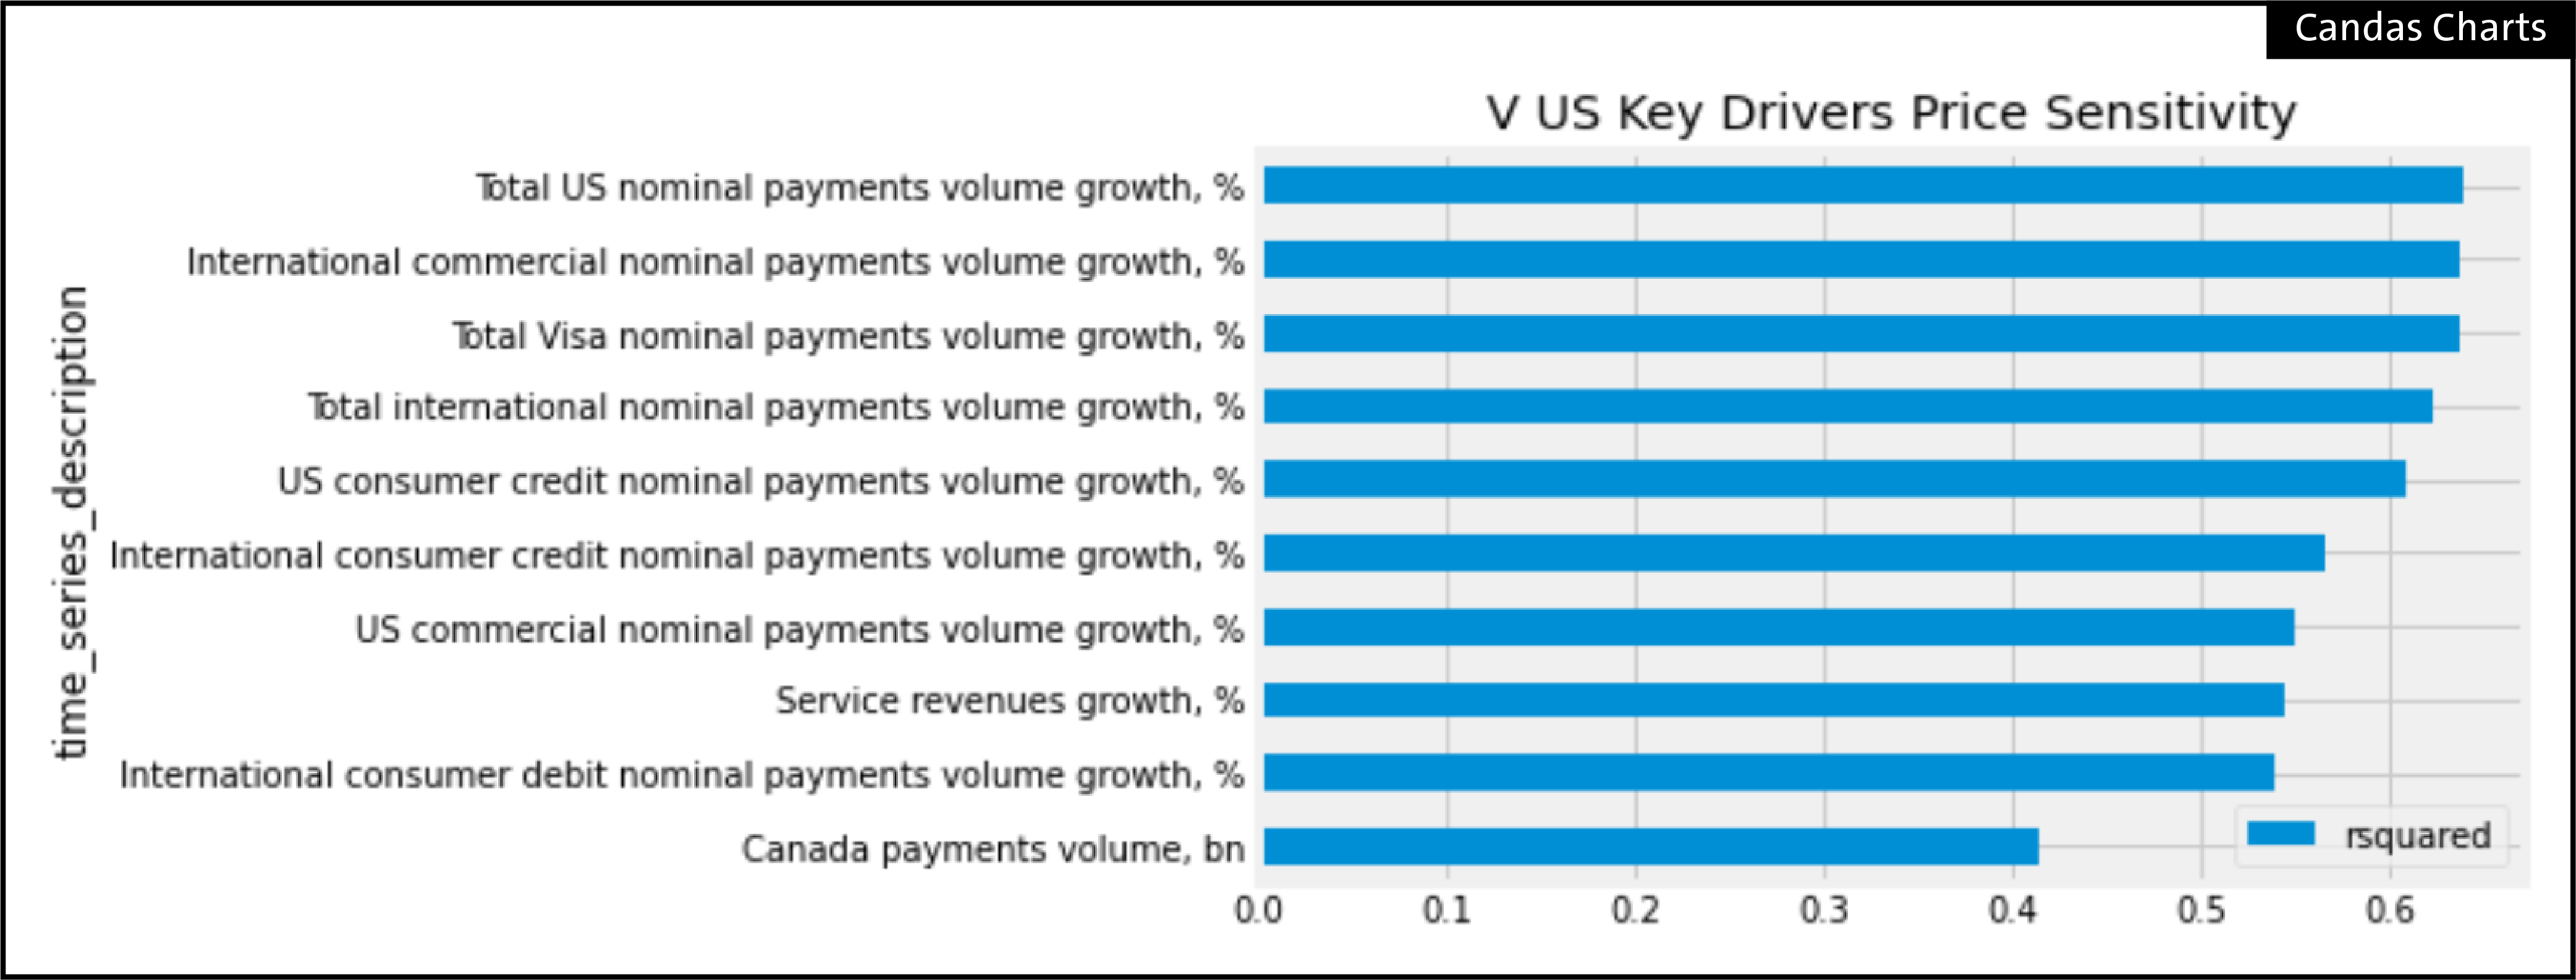
- JPM has a .65 R-squared with V credit volumes. Upon further investigation, Visa’s annual report states: “Service revenues in a given quarter are assessed based on nominal payments volume in the prior quarter” (p.38, footnote 1).
- Bottom line: JPM results are much less statistically significant with Visa credit card volumes than they are with Mastercard. Therefore, we should not read across to Visa credit volumes even though Visa payments volume is a key driver of Visa stock.
02 — JPM FICC trading has a .90 R-squared with Goldman FICC trading.
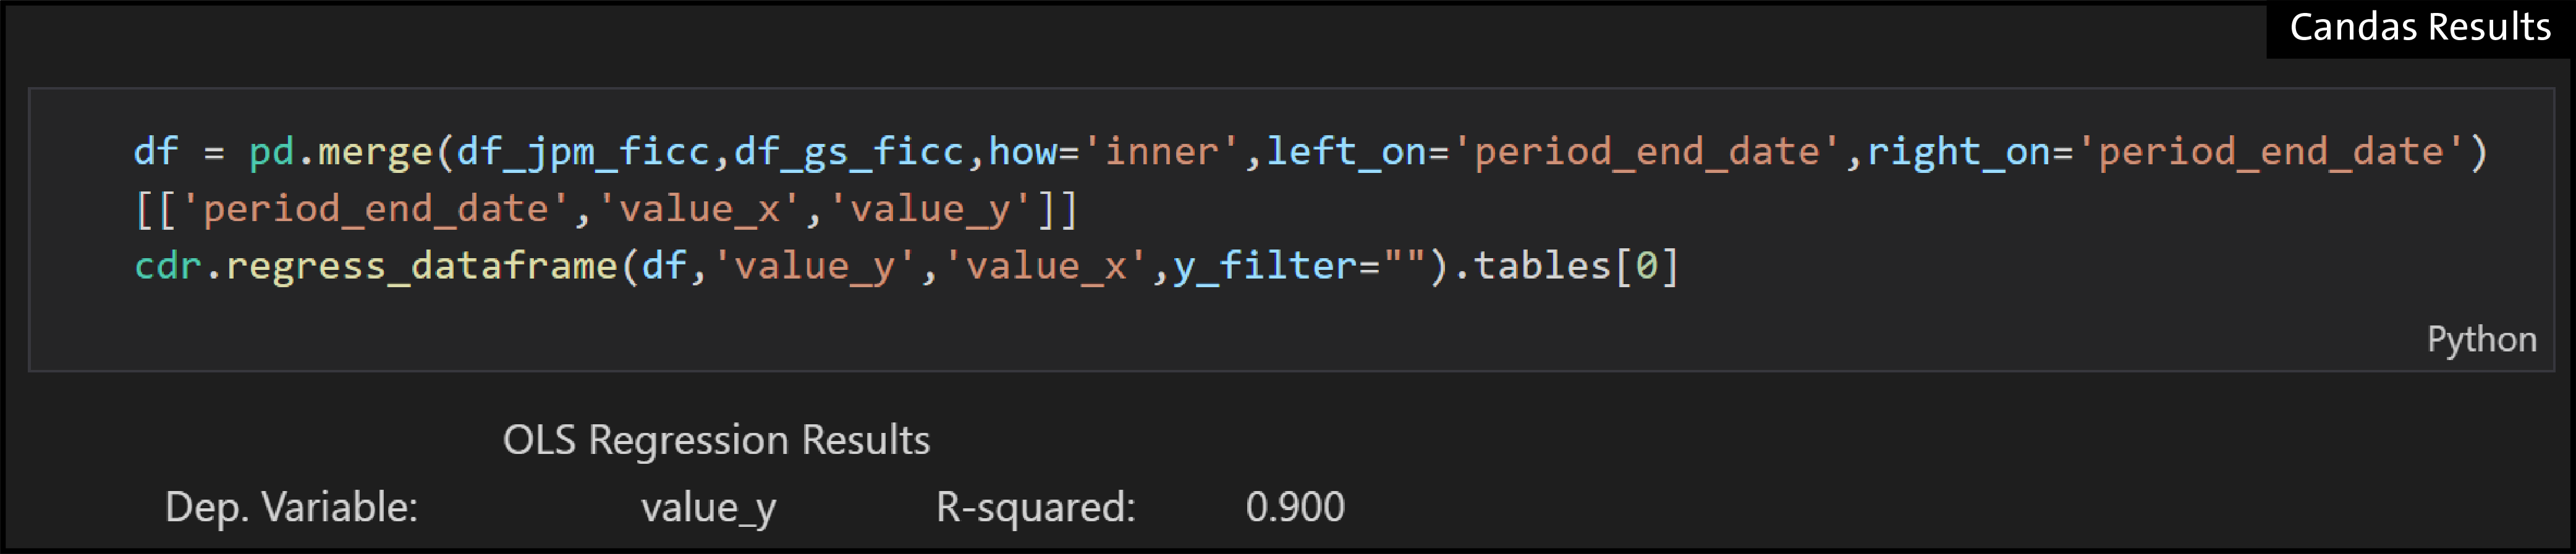
- FICC trading is not a key driver of Goldman stock.
- Assets under management are much more important to Goldman stock. A possible reason for this: FICC trading is a volatile and low multiple business, and investors prefer stickier asset management revenue.
- Bottom line: JPM equity flows are better indicators and provide a better read through to Goldman. The R-squared is .49, but it’s a better read for Goldman.

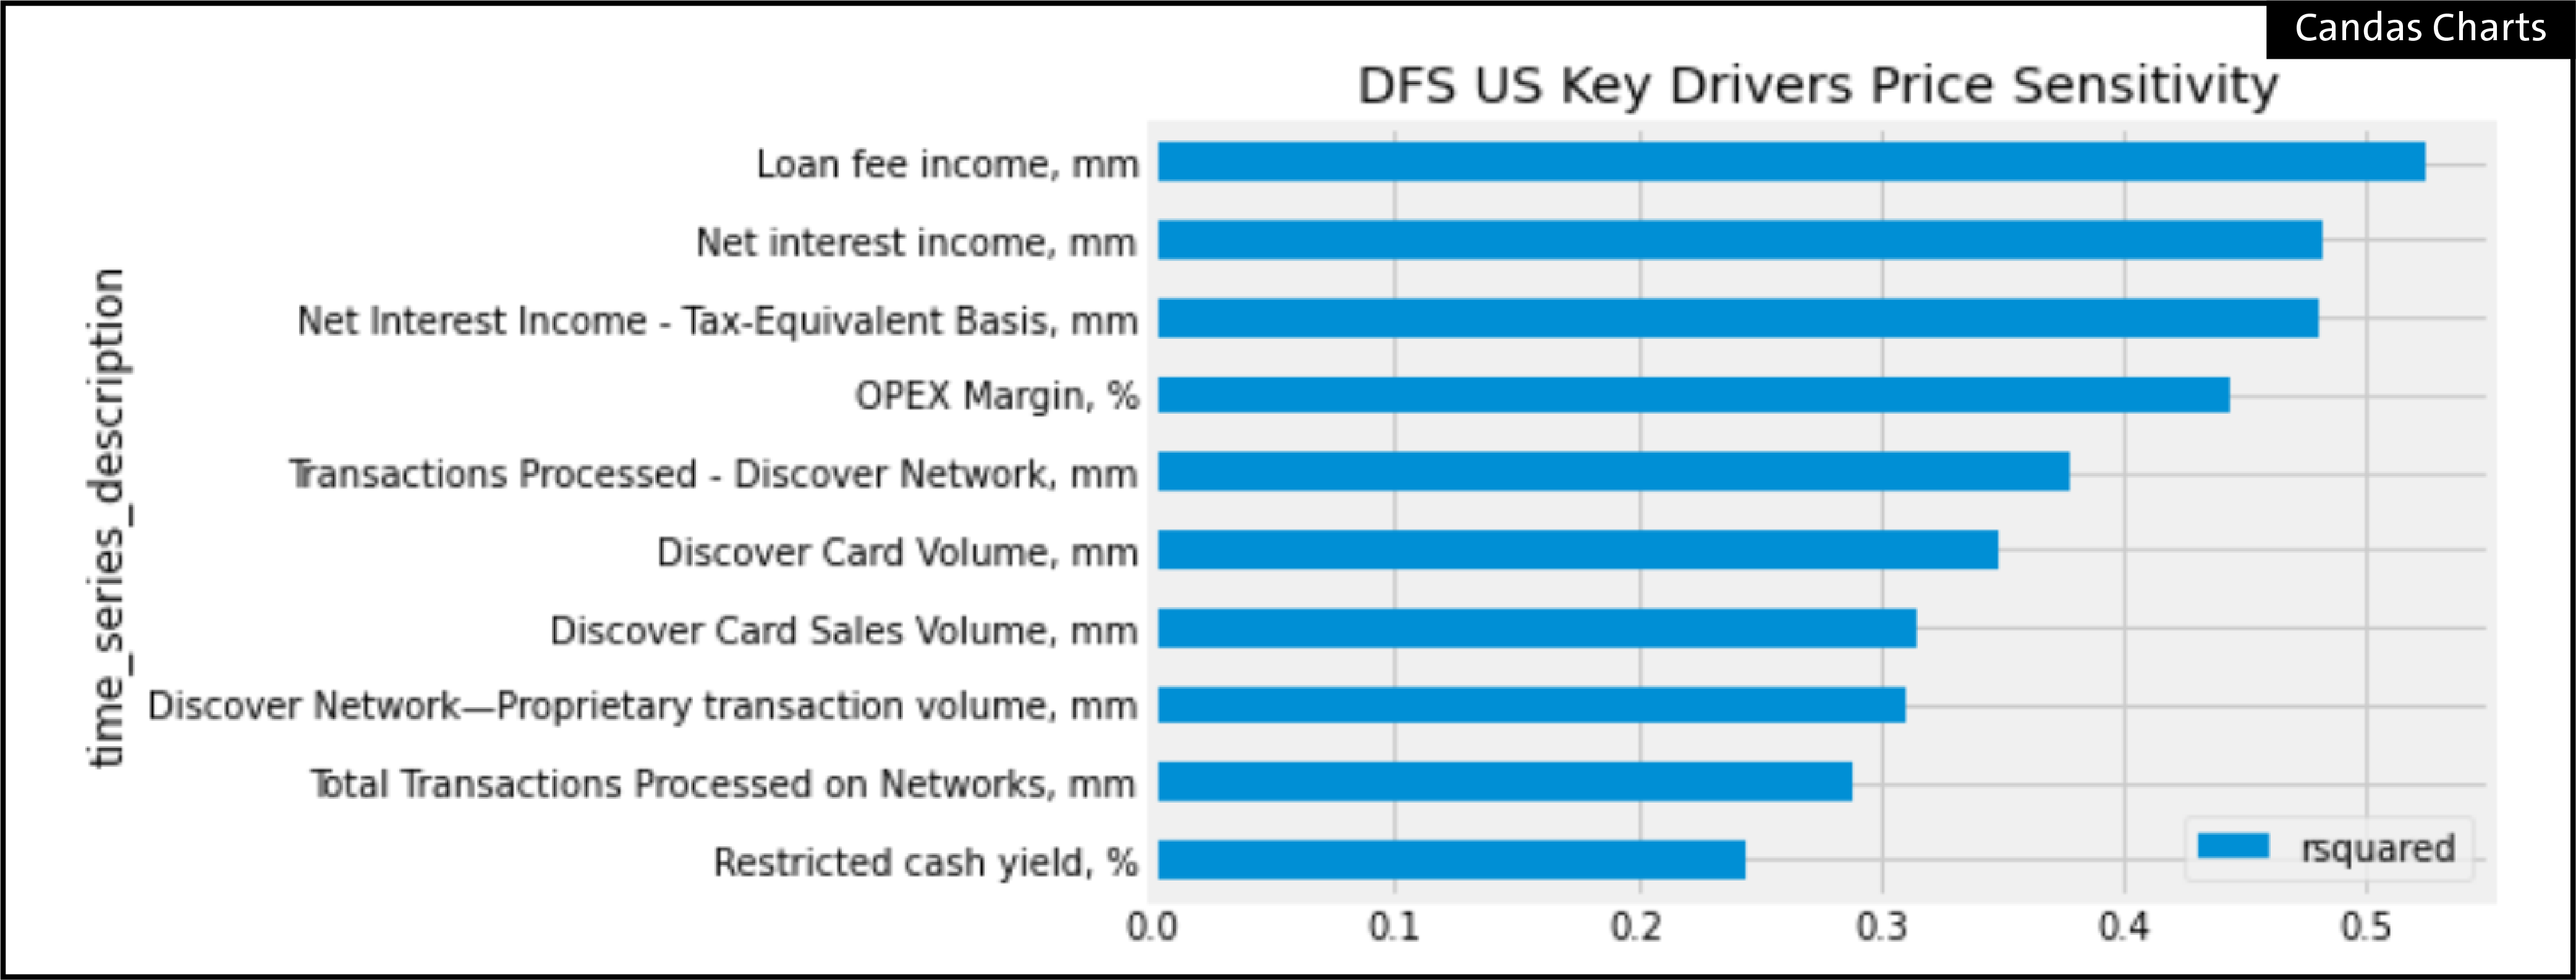
03 — JPM credit card credit has a .90 R-squared with COF and DFS credit.
- However, credit is not a key driver of DFS stock.
- Loan fee income (late charges), net interest income, and OPEX margin are much more influential drivers
- Bottom line: if DFS stock moves on JPM credit, consider a contrarian analysis looking at the three key price / KPI drivers.
Look out for an update as we test our observations using JPM’s annuals on January 14. We will continue to use Candas, specifically our scenario engine, to implement read-through forecast results for multiple other companies in the space.