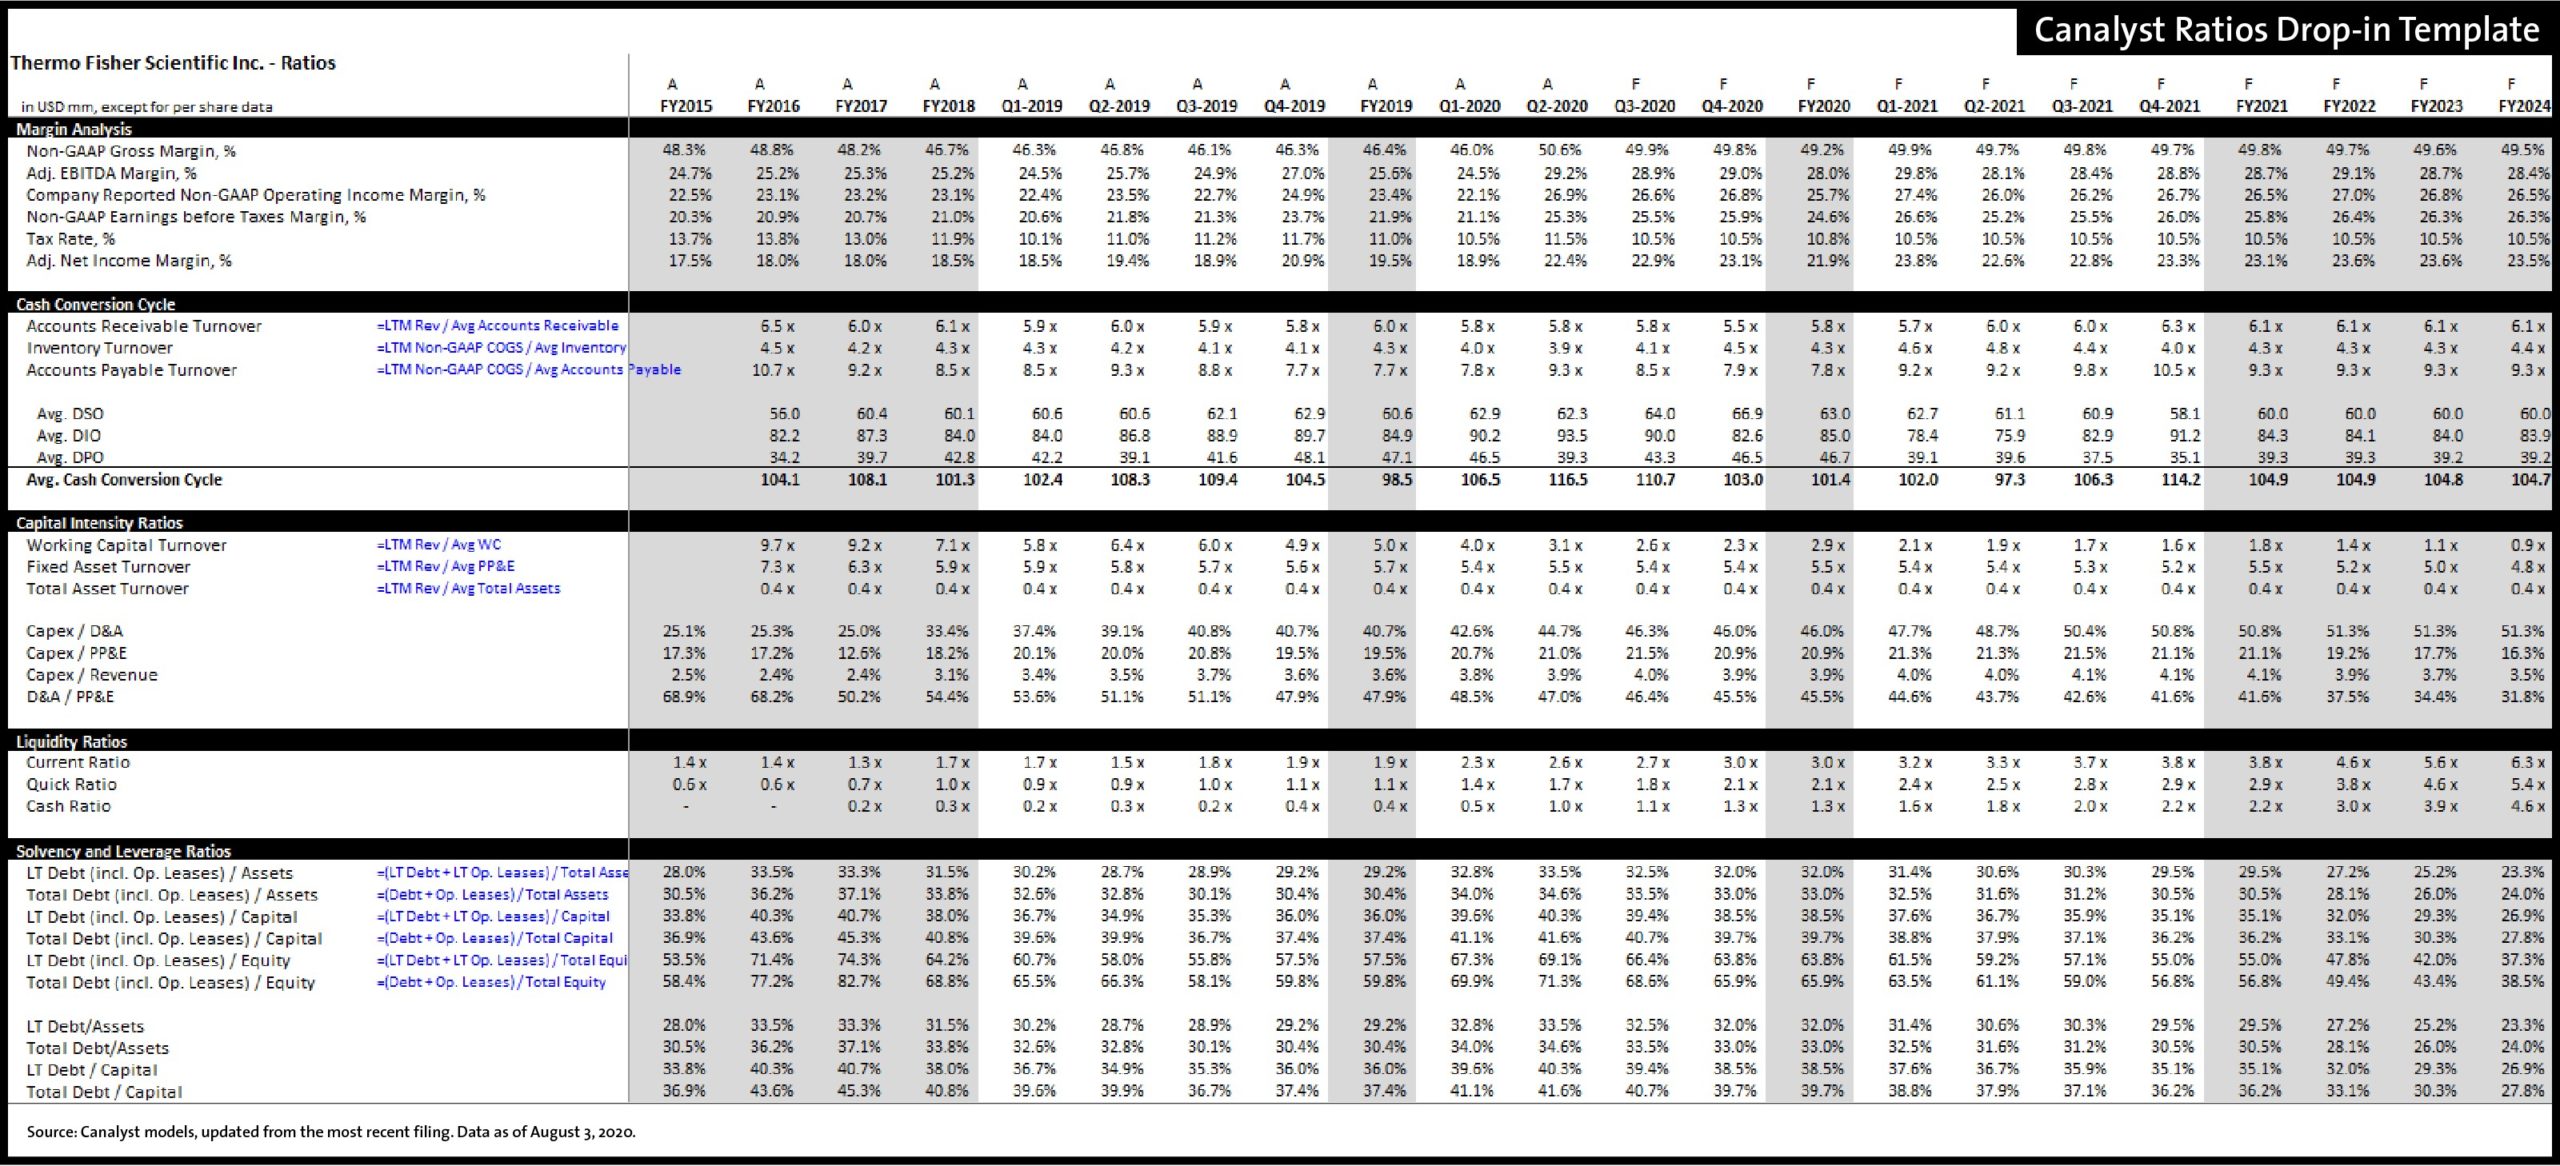
Understanding of a company’s performance has just been made even easier with the launch of our new Ratios Tab. Available in all 4000+ Canalyst models, simply drop it into any model and have it automatically populate with the most important financial ratios. Immediately see the key activity, liquidity, solvency, profitability, and valuation ratios. See how these ratios change as you change the assumptions in the model. All in one place.
- Ratios calculated across 10 years (5 historical, 5 forecasted)
- Easy to customize and extend to your desired time horizon
- Easy to trace how we are calculating all of the ratios
- Easy to print and read
And this is just the beginning. Future iterations will include comp sheets to compare these ratios across different companies, and sector-specific ratios to leverage key metrics and operating stats data.
For more details, clients can visit the Canalyst Web Portal User Guide or download it right away from your Drop In Sheet Templates folder.
Not yet a Canalyst client? Learn more with a demo of our 4000+ equity model platform today.
