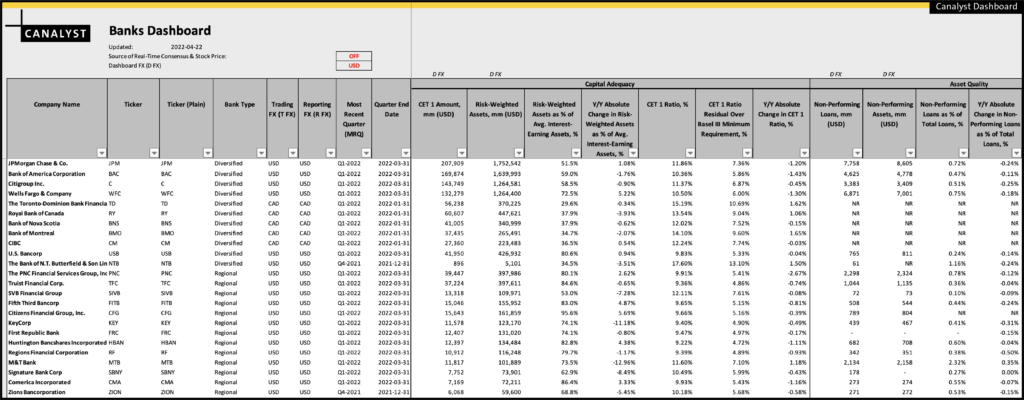
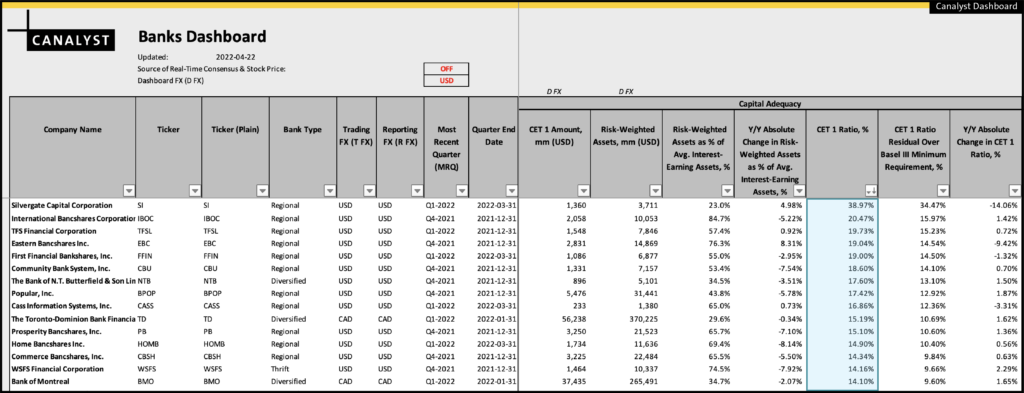
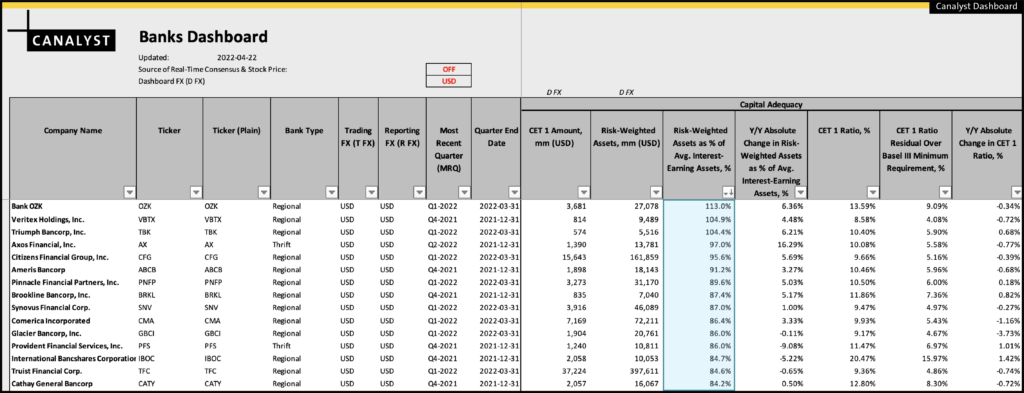
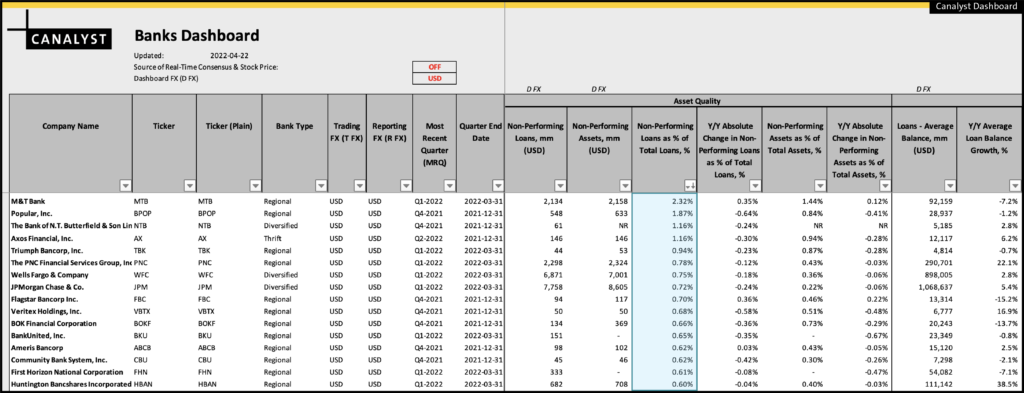
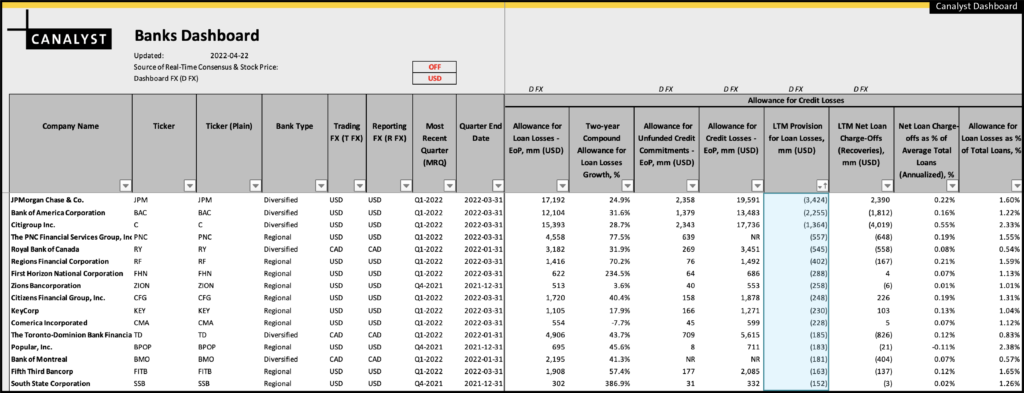
Performance starts with access to the best and most accurate information. The new Canalyst Banks Dashboard is driven by our models, rich with the most precise KPIs for diversified and regional banks so you can make the most informed investment decisions.
Whether you’re running screens or streamlining idea generation, the dashboard’s sortable data includes the following to name a few:
- Relative Pricing, Earnings
- Tangible Book Value
- Book Value
- TCE
- ROE
- ROTCE
- Detailed Analysis of Revenue (NIM, Fee Based)
- Credit Loss Coverage
- Earning Asset Breakdown
- Liability Analysis
- Capital Adequacy
- Shareholder Return (Dividends and Share Repurchases)
Perform detailed CAMELS analysis across the heavily regulated industry, including:
- Confirm that Basel III requirements are being met
- Analyze capital adequacy by studying the spread between reported CET1 ratios and the minimum 4.5% requirement set out by Basel III
- Determine the level of asset risk borne by each bank by inspecting risk-weighted assets as a percentage of interest-earning assets
- Scrutinize asset quality by determining what share of a bank’s loans and assets are deemed non-performing
- Assess how conservatively or aggressively each bank provisioned its allowance for credit and loan losses going into the Covid-19 pandemic by viewing growth rates of loan loss allowances.
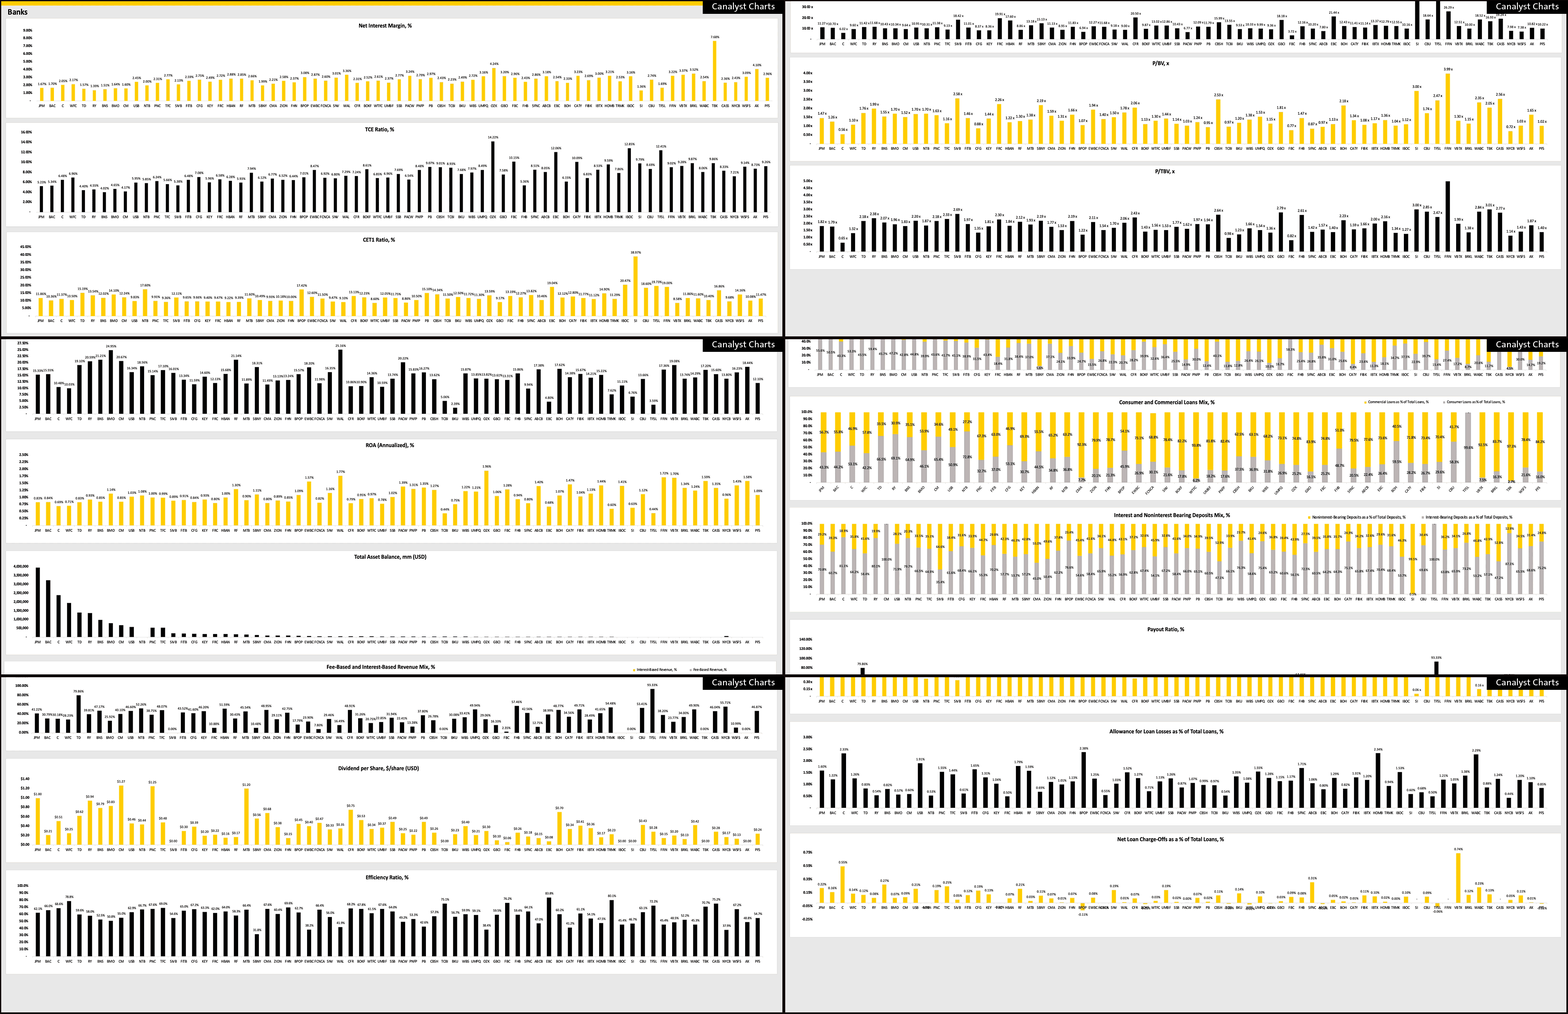
In addition to providing detailed company data, use the Charts tab to get a quick high-level visual of how main revenue drivers such as the net interest margin and the TCE ratio compare across banks in the industry:
Download Canalyst’s Banks Dashboard to dive deeper. Not yet a Canalyst client? Click here to request a demo and begin your analysis today.
