Covid-19 has had a profound impact on the restaurant industry. From capacity constraints to mandated closures, restaurants have been challenged to find new and innovative ways to make ends meet in the last 24 months. McDonald’s (NYSE: MCD) has adapted well reporting over $18 billion in digital systemwide sales during 2021. How will the rest of the industry fare in a post-pandemic era?
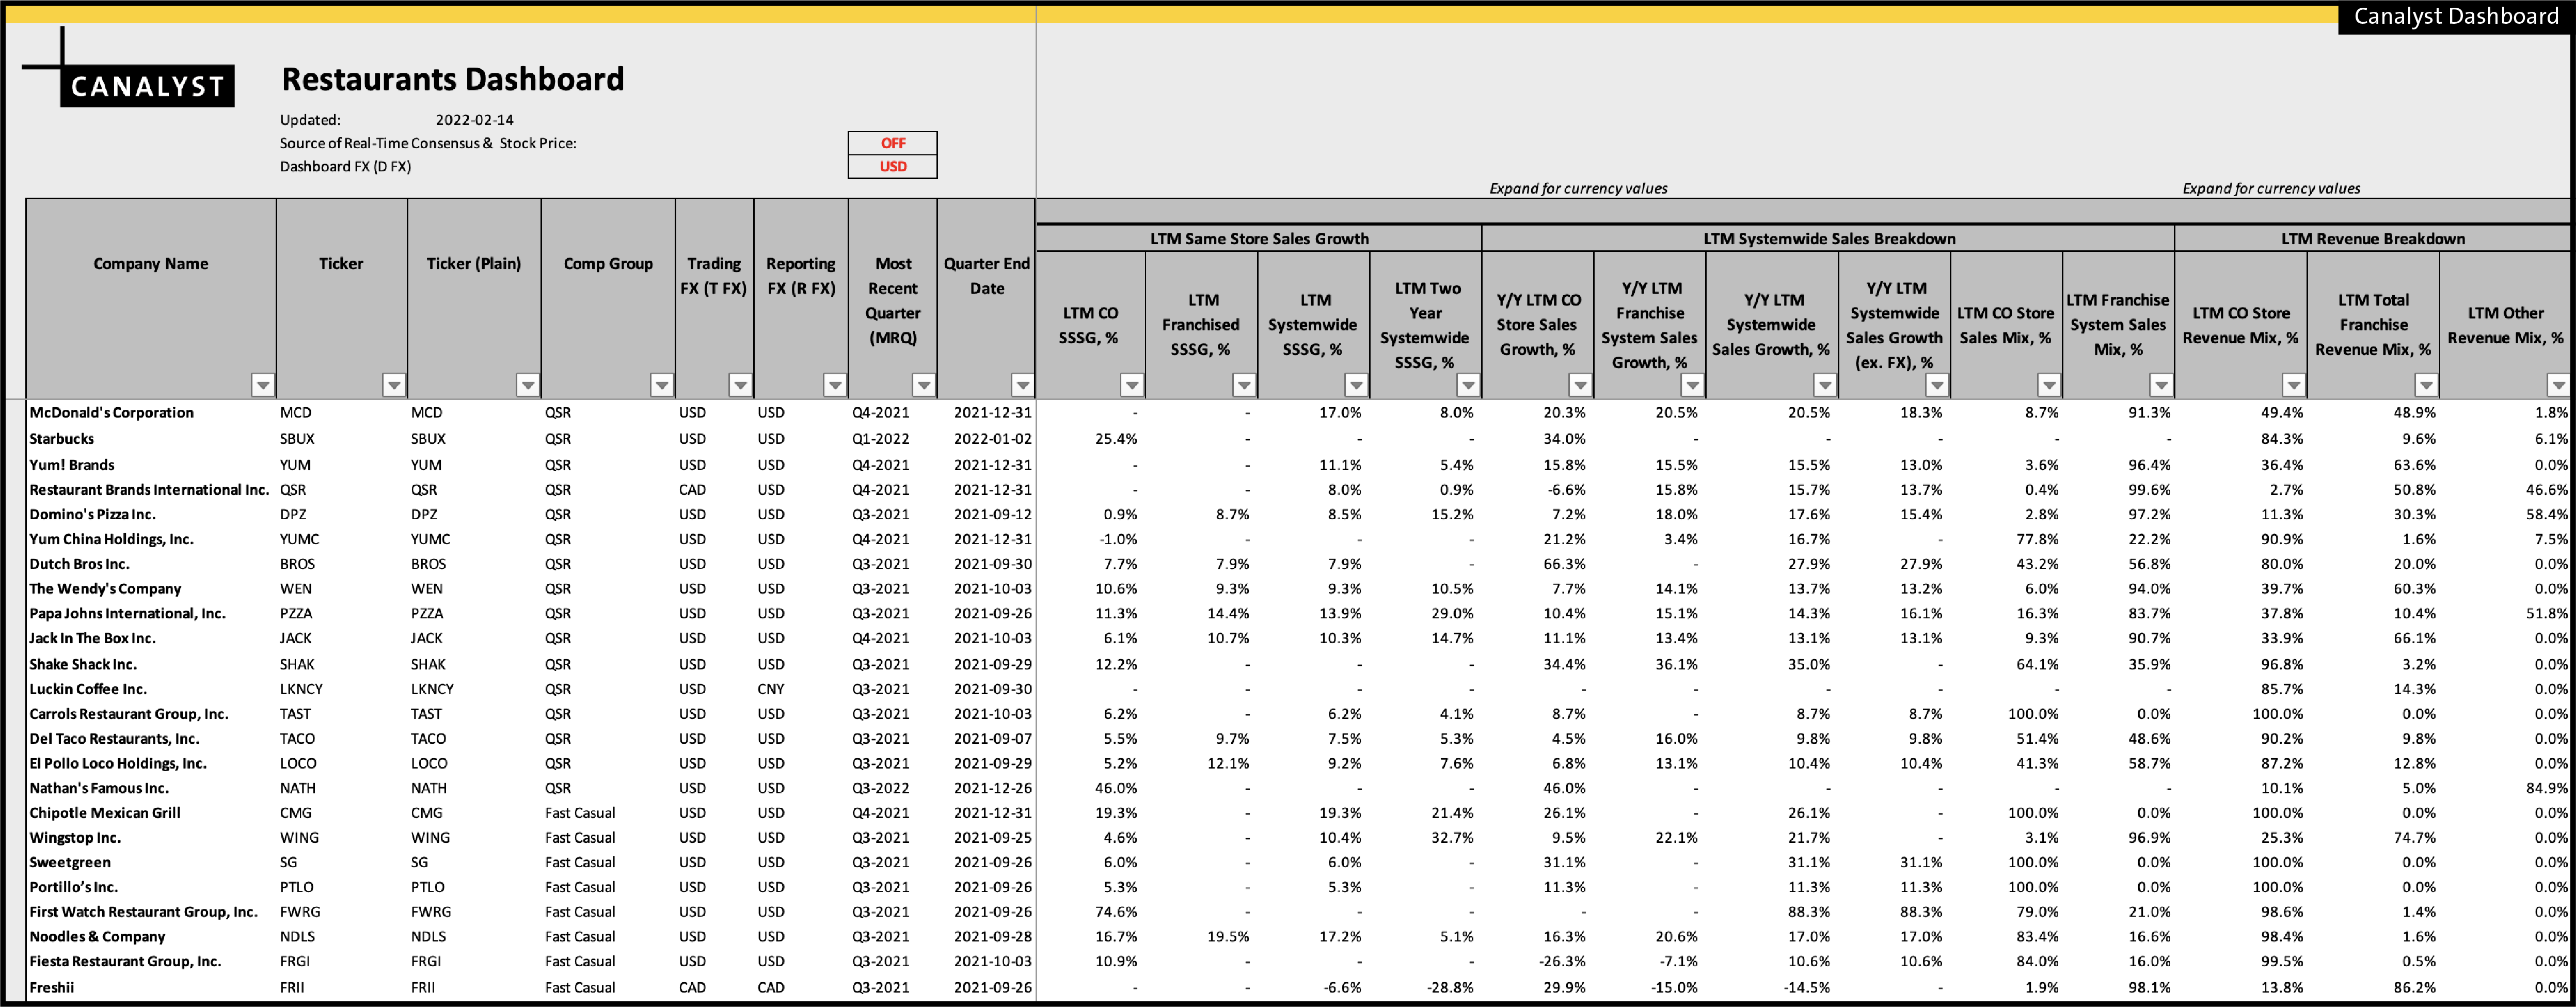
Canalyst’s Restaurants Dashboard allows you to sort and compare tickers in any way you like, facilitating the most efficient analysis.
The Canalyst Restaurants Dashboard compiles valuation, growth, and key operating metrics like Same Store Sales Growth, a Systemwide Sales Breakdown, Restaurant Store Analysis, Digital Sales – and more – from 40+ tickers including SBUX, CMG, and CAKE.
Want to compare the sales mix of DPZ and CMG? Simply filter for these two tickers and carry out your analysis.
Quickly determine which companies operate a heavily franchised model (DPZ) vs. which operate exclusively company owned restaurants (CMG).
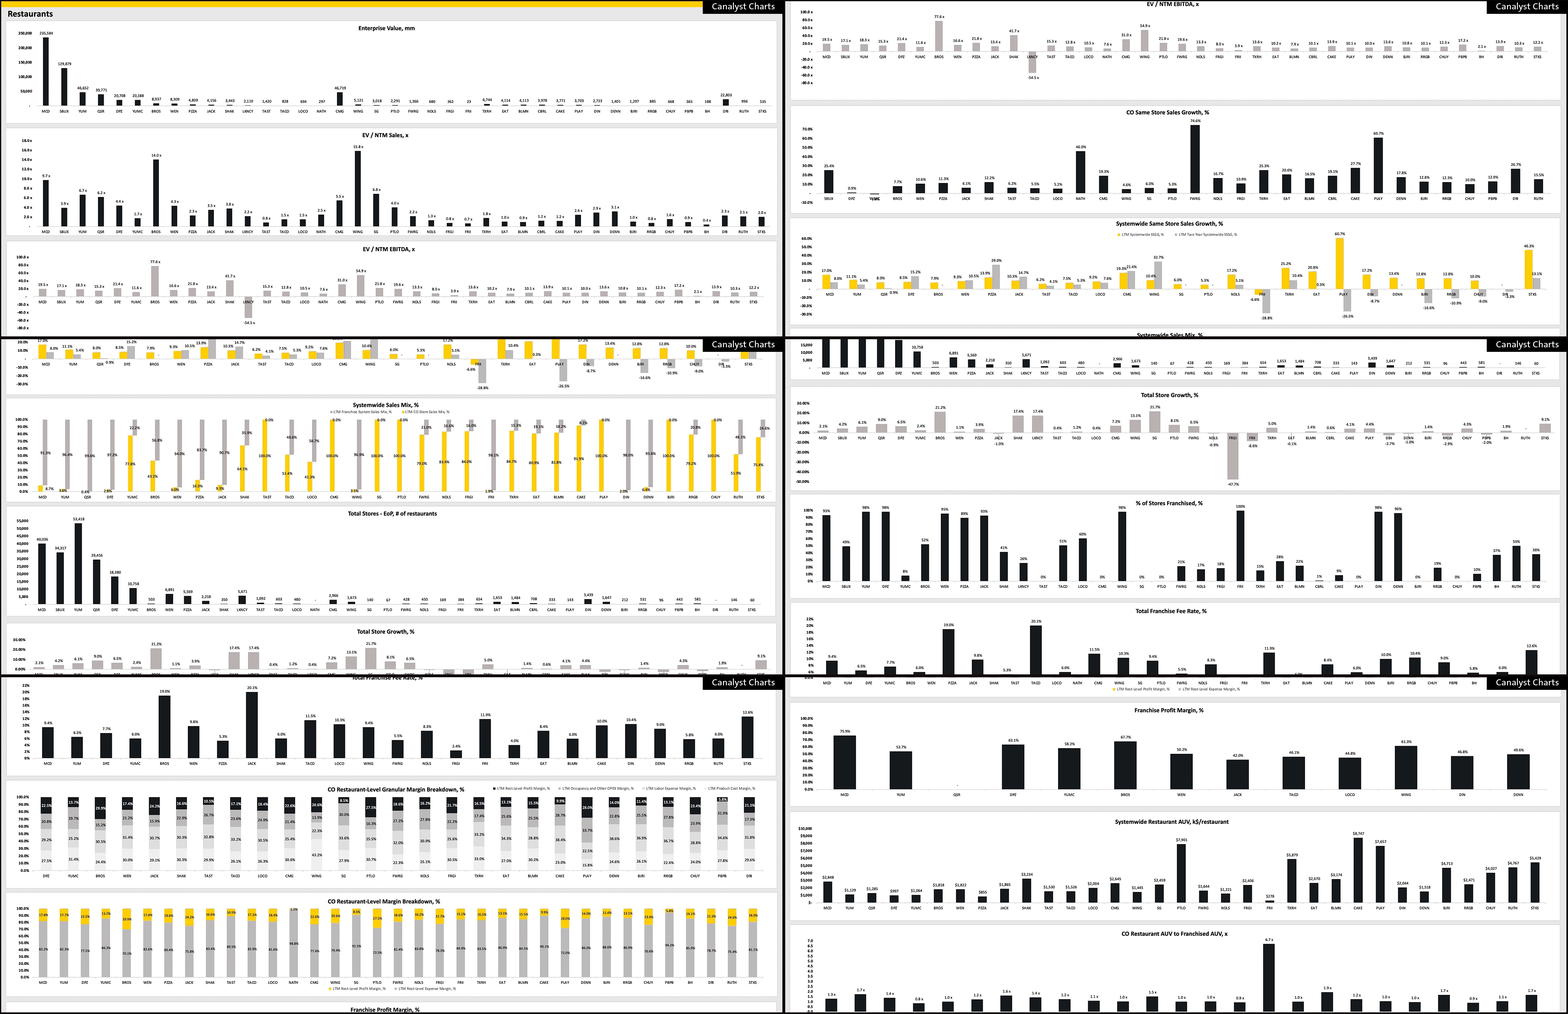
Rather get a quick and comprehensive overview of sales mixes across the entire industry? Clear your filters and switch to the charts tab at the bottom to view the Sales Mix Chart, one of many charts summarizing key data across multiple tickers.
We’ve barely scratched the surface here. Download Canalyst’s Restaurants Dashboard to dive deeper.
Not yet a Canalyst client? Click here to request a demo and begin your analysis today.


